MEAN FROM FREQUENCY TABLE WORKSHEET
Subscribe to our ▶️ YouTube channel 🔴 for the latest videos, updates, and tips.
Work out the mean for each of these frequency tables, you may not use calculator.
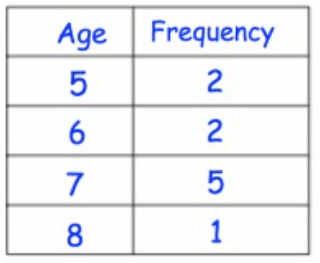
Problem 1 :
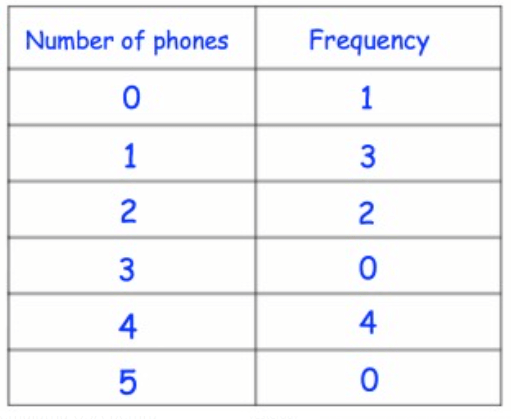
Problem 2 :
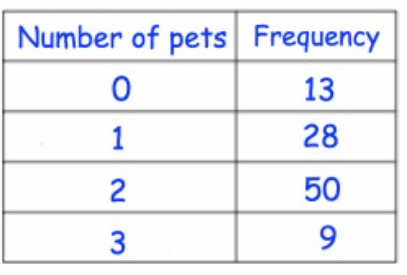
Problem 3 :
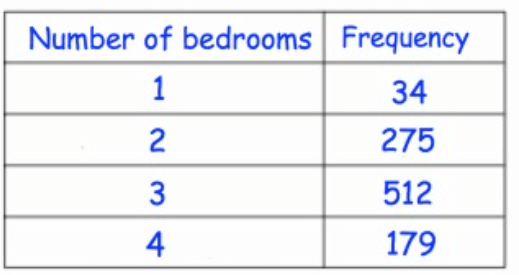
Problem 4 :
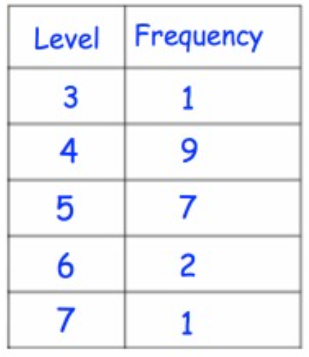
Problem 5 :
Problem 6 :
The tale below shows the data on the heights in cm of 51 children.
|
Class interval 140 ≤ h < 150 150 ≤ h < 160 160 ≤ h < 170 170 ≤ h < 180 |
Frequency 6 16 21 8 |
a) Estimate the mean
b) Estimate the median height
c) Find the modal class
Problem 6 :
The age of children in a primary school were recorded in the table below.
|
Number of days off sick 1 - 5 6 - 10 11 - 15 16 - 20 21 - 25 |
Frequency 12 11 10 4 3 |
a) Estimate the mean
b) Estimate the median
c) Estimate the modal class
Answer Key
1) Mean = 6.5
2) Mean = 2.3
3) Mean = 0.775
4) Mean = 2.802
5) Mean = 4.65
6)
a) Mean = 161
b) Approximately 162 is the median.
c) The high frequency is in the interval 160 ≤ h < 170 and this is the modal class.
7)
a) Mean = 9.875
b) 7.81 is the median.
c) Highest frequency is in the interval 6 - 10, then this is the modal class.
Problem 1 :
Each student in a class of 20 students is assigned a number between 1 and 10 to indicate his or her fitness.

Calculate the
a) mean b) Median c) Mode d) Range
Problem 2 :
The members of a school band were each asked how many musical instruments they played. The results were

Calculate the
a) mean b) Median c) Mode d) Range
Problem 3 :
The following frequency table records the number of books read in the last year by 50 fifteen years old.
a) For this data, find the
a) mean b) Median c) Mode d) Range

b) Construct a vertical bar chart for the data and show the position of the measures of center on the horizontal axis.
c) Describe the distribution of the data
d) Why is the mean smaller than the median for this data ?
e) Which measure of center would be most suitable for this data set ?
Problem 4 :
Hui breeds ducks. The number of ducking survying for each pair after one month is recorded in the table,
a) Calculate the
i) Mean ii) Median iii) Mode iv) Range

b) Is the data skewed
c) How does the skewness of the data affect the measures of the middle of the distribution?
Answer Key
1) a) mean is 7.85.
b) Median = 8
c) mode = 8.
d) Range = 5
2) a) Mean = 1.90
b) 2 is the median
c) mode = 18.
d) Range = 3
3) a) Mean = 5.74
b) 7 is the median
c) Mode = 8
d) Range = 10
b) Construction of vertical bar :

d) The mean takes into account the full range of numbers of books read and is affected by extreme values. Also the values which are lower than the median are well below it.
e) Median.
4)
a) i) Mean = 4.25
ii) Median = 5
iii) mode = 5
b) The mean is negatively skewed
c) The mean is less than the mode and median.
Problem 1 :
Aidan plays 50 games in an arcade. The table shows how many tickets he won in each game.
(a) Work out the missing frequency
(b) Work out the total number of tickets won
(c) Work out the mean number of tickets won per game.
Aidan wants to exchange his ticket for a prize that costs 800 tickets.
(d) How many more games do you expect Aidan would have to play?

Problem 2 :
Max rolls a dice 80 times. The table shows the results.
(a) Find the value of x
(b) Work out the mean score

Problem 3 :
A student was asked to find the arithmetic mean of the numbers 3, 11, 7, 9, 15, 13, 8, 19, 17, 21, 14 and x. He found the mean to be 12. What should be the number in the place of x ?
Problem 4 :
The average of 2, 7, 6 and x is 5 and the average of 18, 1, 6, x and y is 10. What is the value of y.
Problem 5 :
If the mean of 5 observations x, x + 2, x + 4, x + 6 and x + 8 is 11, then the mean of the last three observation is.
Problem 6 :
The mean of the following frequency distribution is 25.2. Find the missing frequency x.
|
Class 0 - 10 10 - 20 20 - 30 30 - 40 40 - 50 |
Frequency 8 x 10 11 9 |
Problem 7 :
Find the missing frequency: mean = 50, Total frequency = 120.
|
x 10 30 50 70 90 |
f 17 f1 32 f2 19 |
Answer Key
1) a) x = 6
b) 203
c) 4.06
d) Expected number of games = 147.
2) a) x = 15
b) Mean = 13.3
3) x = 7
4) x = 5 and y = 20.
5) x = 7, mean of last three observation = 13
6) missing frequency is 12.
7) the missing frequencies are 28 and 24 respectively.
Subscribe to our ▶️ YouTube channel 🔴 for the latest videos, updates, and tips.
Recent Articles
-
Finding Range of Values Inequality Problems
May 21, 24 08:51 PM
Finding Range of Values Inequality Problems -
Solving Two Step Inequality Word Problems
May 21, 24 08:51 AM
Solving Two Step Inequality Word Problems -
Exponential Function Context and Data Modeling
May 20, 24 10:45 PM
Exponential Function Context and Data Modeling