INTERPRETING COLUMN GRAPHS WORKSHEET
Subscribe to our ▶️ YouTube channel 🔴 for the latest videos, updates, and tips.
Problem 1 :
The graph shows attendances at various Friday night events at an Art festivals ?

(a) Which event was most popular ?
(b) How many more people attended the drama than attended Modern dance ?
(c) What percentage of people attended the Jazz ?
Problem 2 :
The column graph shows the number of women diagnosed with breast cancer from 1999 to 2007. Use the graph to determine.
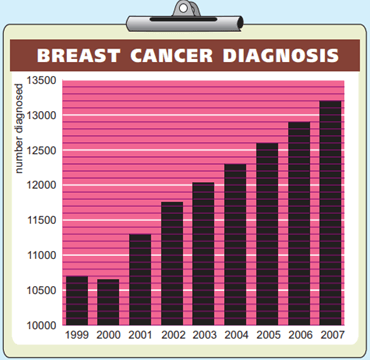
(a) The number of women diagnosed in 2007.
(b) How many more women were diagnosed in 2004 then in 2002.
(c) The percentage increase in cases diagnosed from 2001 to 2006. Solution
Problem 3 :
The graph given below indicates the number of speeding offences over a 10 year period. Determine
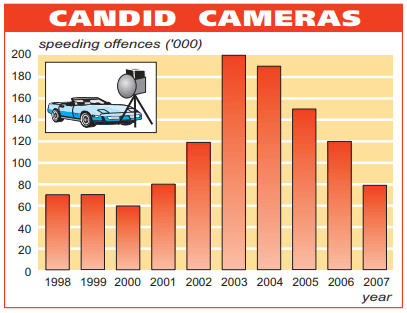
(a) the decrease in number of offences from 2003 to 2007.
(b) the percentage decreases in offences from 2003 to 2007.
(c) Which year showed the greatest increase in offences from the previous year.
(d) the percentage decrease in offences from 2002 to 2007.
Problem 4 :
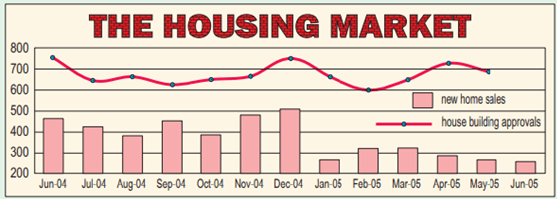
(a) Which month recorded the greatest number of new home sales ?
(b) Find the difference between new home sales in June 04 and January 05.
(c) What was the number of house building approvals in October 04 ?
(d) Find the greatest difference between the number of house building approvals and the number of new home sales in the period June 04 to February 05 ?
Problem 5 :
The graph given below indicates the number of ticketed arts performances in Singapore from 1997 to 2007. Determine :
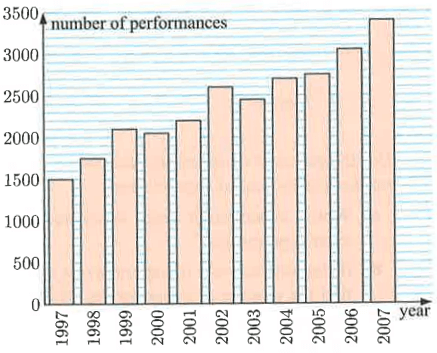
(a) the number of ticketed arts performances in 1997.
(b) the increase in ticketed arts performances from 2006 to 2007
(c) the percentage decrease in ticketed arts performances from 2002 to 2003.
(d) Which year showed the greatest increase in performance from the previous year.
Problem 6 :
The size of Neil's monthly phone bill is displayed in the graph given below.
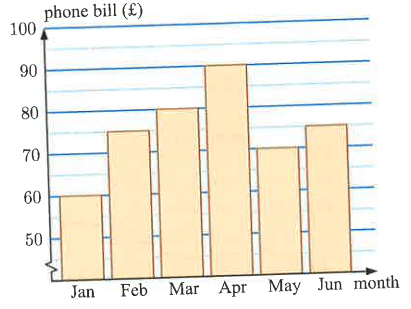
(a) How much was Neil's phone bill in March ?
(b) Find the increase in Neil's phone bill from January to February.
(c) Describe the percentage change in the phone bill from.
(i) March to April
(ii) April to June
Answer Key
1)
(a) Most popular event is Concert.
(b) 1000 more people have attended drama than modern dance.
(c) Percentage of people attended Jazz = 29.7%
2)
(a) The number of women diagnosed is 132000.
(b) 550 more women were diagnosed in 2004.
(c) Approximately 14.2%.
3)
(a) 120 offence reduced in 2007.
(b) Decrease in percentage = 60%
(c) In the year of 2003 the greatest increase in offences.
(d) Percentage of decrease = 33.3%
4)
(a) At December 04
(b) Difference = 480 - 270 ==> 210
(c) House building approvals on October 04 = 650
(d) Difference = 430
5)
(a) Number of performances in 1997 is 1500.
(b) Increase in tickets = 350
(c) approximately 5.8 %.
(d) At 2002 there is greatest difference.
6)
(a) Neil's phone bill in March = 80
(b) Increase in January to February = 75 - 60 ==> 15
(c) (i) Percentage change from March to April = 12.5%
(ii) 16.7 % is the required percentage change.
Problem 1 :
The bar graph shows the number of different items sold in an electrical goods store in a given month.

(a) How many DVD players were sold for the month ?
(b) How many more computers were sold than television sets ?
(c) What percentage of the items sold were cooling fans ?
Problem 2 :
(a) Estimate the median house price in 2008 in
(i) London
(ii) Liver pool

(b) How much bigger is the median house price in Edinburgh than Glasgow ?
(c) What percentage is the median Birmingham price of the median Liverpool price in the year 2008?
Problem 3 :
The graph along side displays the result of a national phone in of children ages six to sixteen as to what they do at home between 3 pm to 6 pm

(a) Use the graph to determine the percentage of children who.
(i) Watch TV, videos, play with computers or listen to music.
(ii) Spend time with friends, siblings or pets.
(b) If 240 children were surveyed.
(i) How many do school work ?
(ii) How many spend more time on the phone rather than do chores ?
Problem 4 :
The bar graphs shows the crude oil reserves for the top five oil producing countries in the world.

(a) How many billion barrels of crude oil do these countries have in total ?
(b) How many more barrels can Saudi Arabia produce than Iraq?
(c) What percentage of the crude oil is held by Iran ?
Problem 5 :
The bar chart shows the ages of children in a youth club.
(a) What is the modal age?
(b) What is the range of the ages?
(c) What fraction of the children are 11?
(d) What percentage of the children are older than 13?

Answer Key
1)
(a) By observing the bar graph, 70 DVD players were sold for the month.
(b) 60 computers were sold out.
c) Percentage of cooling fans = 27%
2)
(a) (i) length of bar of London = 353000
(ii) Liver pool = 278000
(b) Price in Edinburg = 43000
(c) Price in Birmingham = 92.59%
3)
(a) (i) 35% of children who watch TV, videos, play with computers or listen to music.
(ii) Which is closer to 20%, so 19% o children spend time with friends, siblings or pets.
(b) 29 children do their school work.
Number of children spend time on chores = 10 children
4)
a) 955 barrels are in total.
b) Saudi Arabia has produced 110 more barrels than Iraq.
c) 15.7% of crude oil produced by Iran.
5)
a) 12 is the modal class
b) 5 years
c) Percentage children who are more than 11 = 64%
d) Percentage of children older than 13 = 12%
Subscribe to our ▶️ YouTube channel 🔴 for the latest videos, updates, and tips.
Recent Articles
-
Finding Range of Values Inequality Problems
May 21, 24 08:51 PM
Finding Range of Values Inequality Problems -
Solving Two Step Inequality Word Problems
May 21, 24 08:51 AM
Solving Two Step Inequality Word Problems -
Exponential Function Context and Data Modeling
May 20, 24 10:45 PM
Exponential Function Context and Data Modeling