READING AND INTEPRETING COLUMN GRAPHS
Subscribe to our ▶️ YouTube channel 🔴 for the latest videos, updates, and tips.
Problem 1 :
The graph shows attendances at various Friday night events at an Art festivals ?

(a) Which event was most popular ?
(b) How many more people attended the drama than attended Modern dance ?
(c) What percentage of people attended the Jazz ?
Solution :
(a) Most popular event is Concert.
(b) Number of people attended Drama = 3500
Number of people attended modern dance = 2500
Difference = 3500 - 2500 ==> 1000
1000 more people have attended drama than modern dance.
(c) Percentage of people attended Jazz :
Number of people attended,
Drama = 3500, Jazz = 5500, Modern dance = 2500,
Concert = 7000
Total = 3500 + 5500 + 2500 + 7000
= 18500
Percentage of people who attended Jazz
= (5500/18500) x 100%
= 0.297 x 100%
= 29.7%
Problem 2 :
The column graph shows the number of women diagnosed with breast cancer from 1999 to 2007. Use the graph to determine.
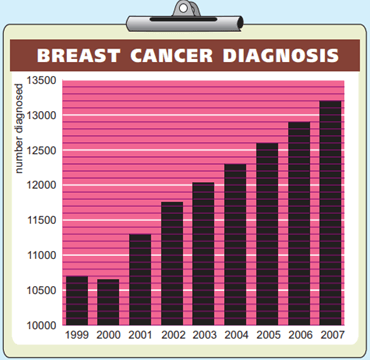
(a) The number of women diagnosed in 2007.
(b) How many more women were diagnosed in 2004 then in 2002.
(c) The percentage increase in cases diagnosed from 2001 to 2006.
Solution :
(a) The number of women diagnosed is 132000.
(b) Number of women diagnosed in 2004 = 12300
Diagnosed in 2002 = 11750
Difference = 12300 - 11750
= 550
550 more women were diagnosed in 2004.
(c) In 2001 = 11300, in 2006 = 12900
Percentage change = {(12900 - 11300)/11300} x 100%
= (1600/11300) x 100%
= 0.1415 x 100%
= 14.15 %
Approximately 14.2%.
Problem 3 :
The graph given below indicates the number of speeding offences over a 10 year period. Determine
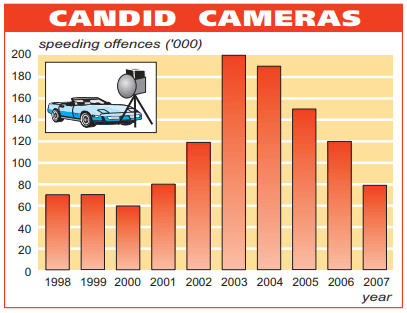
(a) the decrease in number of offences from 2003 to 2007.
(b) the percentage decreases in offences from 2003 to 2007.
(c) Which year showed the greatest increase in offences from the previous year.
(d) the percentage decrease in offences from 2002 to 2007.
Solution :
(a) Number of offences in 2003 = 200
Number of offences in 2007 = 80
Decrease = 200 - 80 ==> 120
So, 120 offence reduced in 2007.
(b) Decrease in percentage = (120/200) x 100%
= 60%
(c) In the year of 2003 the greatest increase in offences.
(d) offences in 2002 = 120
offences in 2007 = 80
Percentage of decrease = {(120-80)/80} x 100%
= (40/120) x 100%
= 33.3%
Problem 4 :
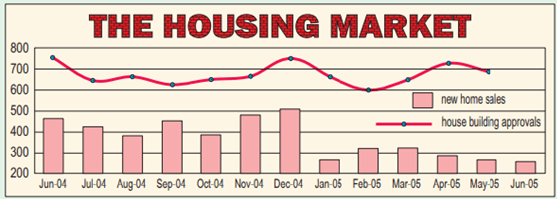
(a) Which month recorded the greatest number of new home sales ?
(b) Find the difference between new home sales in June 04 and January 05.
(c) What was the number of house building approvals in October 04 ?
(d) Find the greatest difference between the number of house building approvals and the number of new home sales in the period June 04 to February 05 ?
Solution :
(a) At December 04
(b) New home sales on June 04 = 480
New home sales on Jan 05 = 270
Difference = 480 - 270 ==> 210
(c) House building approvals on October 04 = 650
(d) New building approval on Jan 04 = 750
On February 05 = 320
Difference = 750 - 320
= 430
Problem 5 :
The graph given below indicates the number of ticketed arts performances in Singapore from 1997 to 2007. Determine :
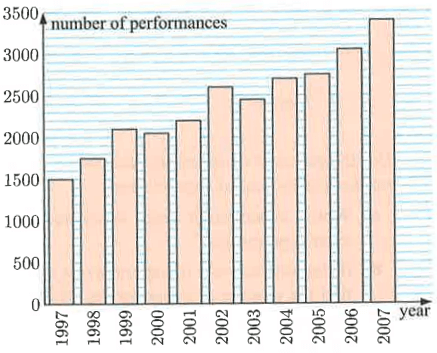
(a) the number of ticketed arts performances in 1997.
(b) the increase in ticketed arts performances from 2006 to 2007
(c) the percentage decrease in ticketed arts performances from 2002 to 2003.
(d) Which year showed the greatest increase in performance from the previous year.
Solution :
(a) Number of performances in 1997 is 1500.
(b) Number of performance in 2006 = 3050
Number of performance in 2007 = 3400
Increase in tickets = 3400 - 3050 ==> 350
(c) Difference in number of performance in 2002 to 2003
= 2600 - 2450
= 150
Percentage = (150/2600) x 100%
= 5.76%
approximately 5.8 %.
(d) At 2002 there is greatest difference.
Problem 6 :
The size of Neil's monthly phone bill is displayed in the graph given below.
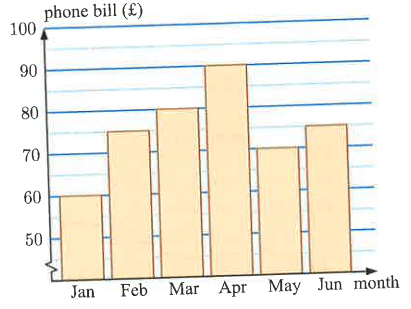
(a) How much was Neil's phone bill in March ?
(b) Find the increase in Neil's phone bill from January to February.
(c) Describe the percentage change in the phone bill from.
(i) March to April
(ii) April to June
Solution :
(a) Neil's phone bill in March = 80
(b) Increase in January to February = 75 - 60 ==> 15
(c)
(i) Percentage change from March to April
= {(90-80)/80} x 100%
= (10/80) x 100%
= 12.5%
(ii) Percentage change from April to June :
= {(90-75)/90} x 100%
= (15/90) x 100%
= 16.66 %
So, 16.7 % is the required percentage change.
Problem 7 :
Shown are the ages of 20 friends. Work out the mean age.

Solution :
- Age 18 is repeating 5 times
- Age 19 is repeating 5 times
- Age 20 is repeating 7 times
- Age 21 is repeating 1 time
- Age 22 is repeating 1 time
- Age 23 is repeating 1 time
Mean = [5(18) + 5(19) + 7(20) + 1(21) + 1(22) + 1(23)]/(5 + 5 + 7 + 1 + 1 + 1)
= (90 + 95 + 140 + 21 + 22 + 23)/20
= 391/20
= 19.55
Mean age is approximately 20.
Subscribe to our ▶️ YouTube channel 🔴 for the latest videos, updates, and tips.
Recent Articles
-
Finding Range of Values Inequality Problems
May 21, 24 08:51 PM
Finding Range of Values Inequality Problems -
Solving Two Step Inequality Word Problems
May 21, 24 08:51 AM
Solving Two Step Inequality Word Problems -
Exponential Function Context and Data Modeling
May 20, 24 10:45 PM
Exponential Function Context and Data Modeling