ALGEBRA 1 STAAR RELEASED TEST
Subscribe to our ▶️ YouTube channel 🔴 for the latest videos, updates, and tips.
Problem 1 :
The table shows the net revenue in millions of dollars of a company every three months for two years. An exponential function can be used to model the data.
Company
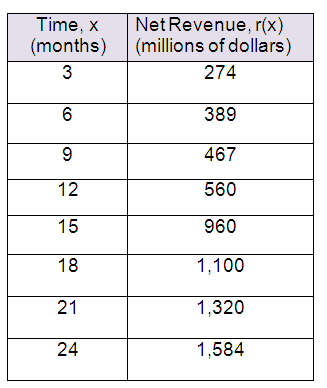
Which function best models the data ?
|
F) r(x) = 223.06(1.09)x H) r(x) = 2,232.91(0.92)x |
G) r(x) = 1.09(223.06)x J) r(x) = 0.92(2,232.91)x |
Problem 2 :
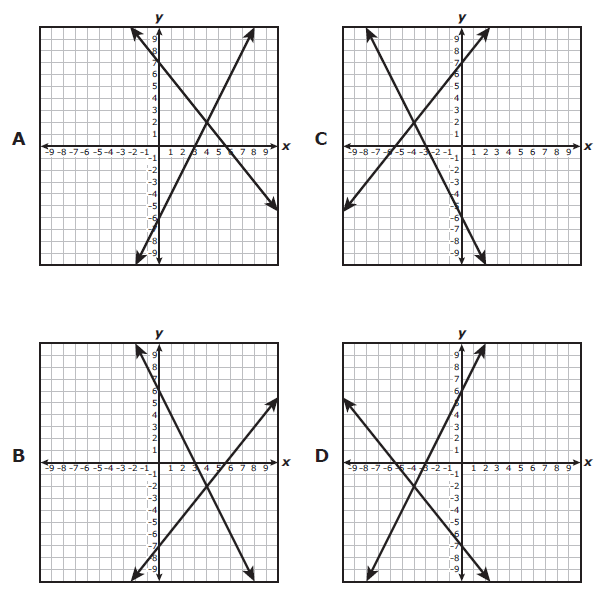
Which graph best represents this system of equations and its solution ?
2x = 6 - y
5x - 4y = 28
Problem 3 :
Which function is equivalent to k(x) = x2 + 2x - 15 ?
F) k(x) = (x + 15) (x - 1) G) k(x) = (x + 1) (x - 15)
H) k(x) = (x + 5) (x - 3) J) k(x) = (x + 3) (x - 5)
Problem 4 :
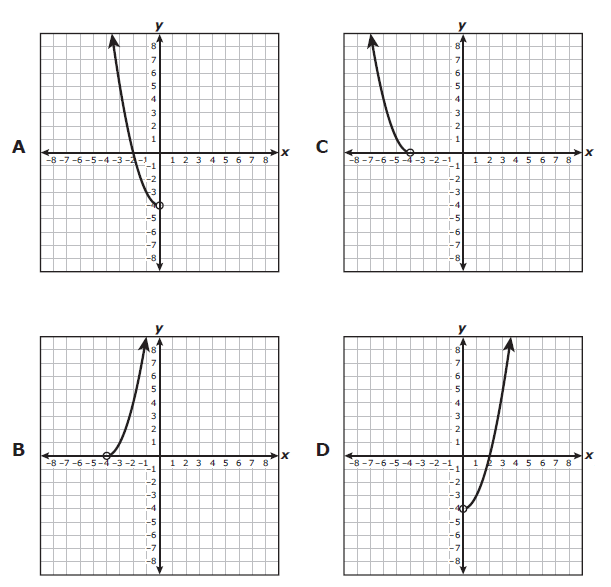
Which graph best represents part of a quadratic function with a domain of all real numbers less than -4 ?
Problem 5 :
The graph of a line passes through the points (-3, 1) and (5, 8).
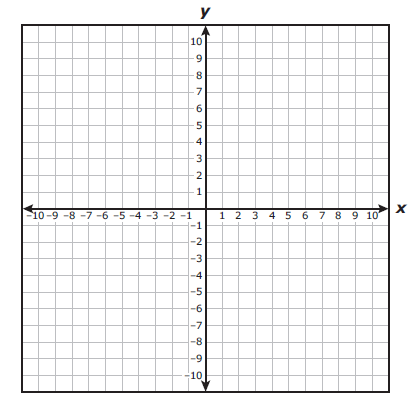
What is the slope of the line ?
F) 9/2 G) 7/8 H) -9/2 J) -7/8
Problem 6 :
A mail carrier delivers mail on one of two different routes : a morning route or an afternoon route. Each workday the mail carrier is assigned one of these two routes.
i) Last month the mail carrier delivered mail on the morning route 16 times and on the afternoon route 12 times, for a total distance traveled of 141 miles.
ii) This month the mail carrier delivered mail on the morning route 10 times and on the afternoon route 15 times, for a total distance traveled of 123.75 miles.
What is the distance of the morning route in miles ?
A) 5.25 ml B) 6.00 ml C) 4.75 ml D) 5.00 ml
Problem 7 :
Quadratic functions p and q are graphed on the grid. The graph of p was transformed to create the graph of q.
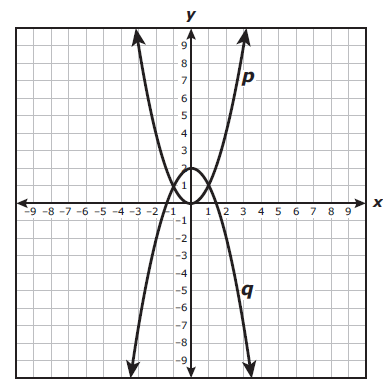
Which function best represents the graph of q ?
|
F) q(x) = -(x - 2)2 H) q(x) = -x2 - 2 |
G) q(x) = -(x + 2)2 J) q(x) = -x2 + 2 |
Problem 8 :
What is the solution to this equation ?
2(40 - 5y) = 10y + 5(1 - y)
A) 7.5 B) 15 C) 5 D) Not here
Problem 9 :
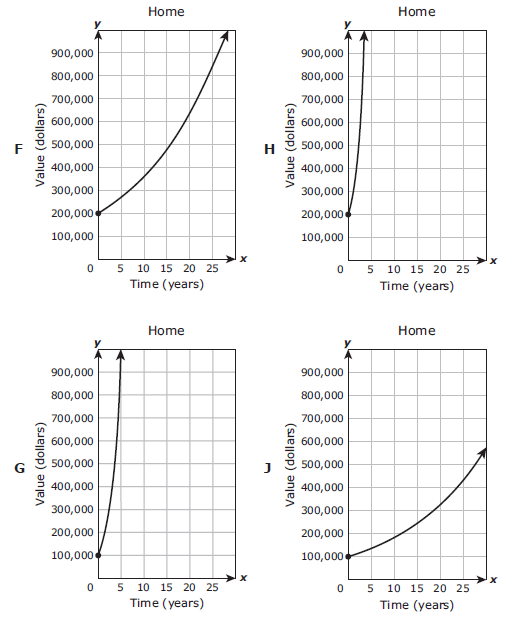
The initial value of a home is $200,000. The value of the home will increase at a rate of 6% each year.
Which graph best models this situation ?
Problem 10 :
A coach has 96 golf balls for the school's golf team. The coach will give each player on the team 8 golf balls. The graph shows the linear relationship between y, the number of golf balls remaining for the team, and x, the number of players on the team.
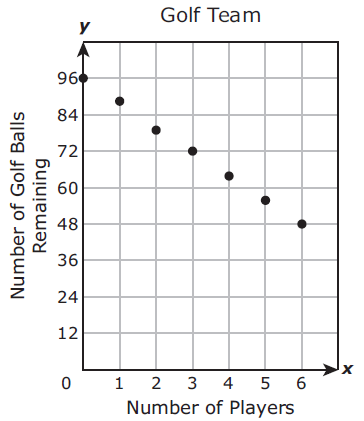
The coach will use no more than 6 players on the school's golf team. Which set best represents the range of the function for this situation ?
A) {96, 84, 72, 60, 48, 36, 24} B) {8, 9, 10, 11, 12, 13, 14}
C) {96, 88, 80, 72, 64, 56, 48} D) {0, 1, 2, 3, 4, 5, 6}
Problem 11 :
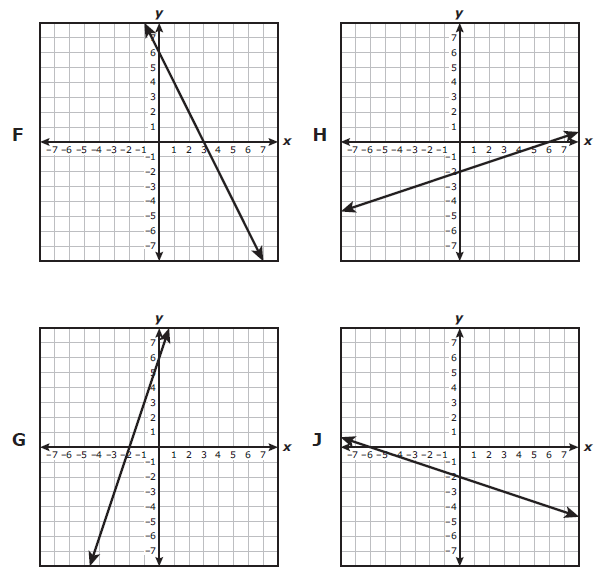
Linear function k has a zero of -2 and a y - intercept of 6. Which graph best represents k ?
Subscribe to our ▶️ YouTube channel 🔴 for the latest videos, updates, and tips.
Recent Articles
-
Finding Range of Values Inequality Problems
May 21, 24 08:51 PM
Finding Range of Values Inequality Problems -
Solving Two Step Inequality Word Problems
May 21, 24 08:51 AM
Solving Two Step Inequality Word Problems -
Exponential Function Context and Data Modeling
May 20, 24 10:45 PM
Exponential Function Context and Data Modeling