PROBLEMS USING PICTOGRAPHS WORKSHEET
Subscribe to our ▶️ YouTube channel 🔴 for the latest videos, updates, and tips.
Problem 1 :
Use the pictograph below to answer the questions that follow.
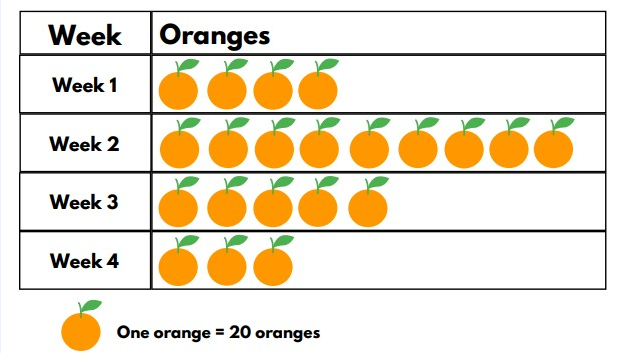
1) How many oranges were sold during the third week?
2) During which week were the most oranges sold and how much?
3) What is the difference between the amount of oranges sold during week 2 and week 3?
4) What is the total amount of oranges sold over the 4 week period?
Problem 2 :
Salamander class went on a bug hunt looking for bugs in different habitats.
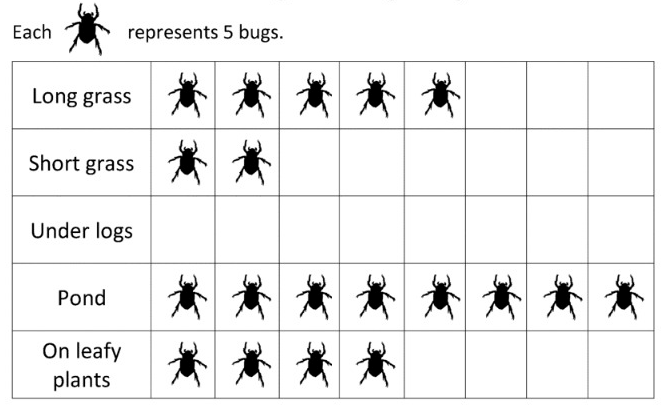
1) 30 bugs were found in under logs. Show this in the picture graph.
2) What was the most common place to find bugs? _____
How many bugs were found there? _____
3) What was the least common place to find bugs? _____
How many bugs were found there?
4) How many more bugs were found in the long grass than the short grass?
5) Double the number of bugs were found in the pond than on leafy plants.
True or false? _____
6) How many bugs were found in total that day? _____
Problem 3 :
A pie shop sells a range of different pies. Here are the sales figure for the number of pies sold for each day in a week.
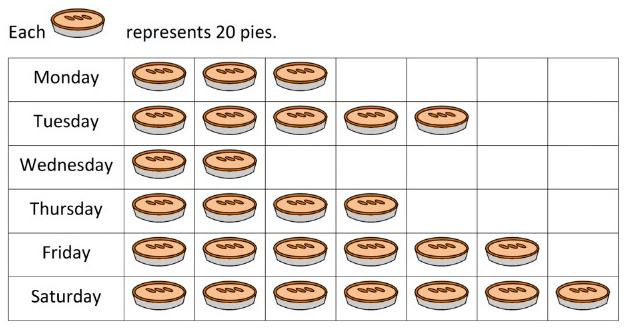
1) How many pies were sold on Thursday? _____
2) Which day were the most pies sold? _____
How many pies were sold on that day? _____
3) How many more pies were sold on Tuesday than Wednesday? _____
4) There were more pies sold on the last two days than the first four days. True or false? _____
5) How many pies were sold in total that week? _____
6) Draw a bar graph for the number of pies sold that week.
Problem 4 :
A group of kids voted their favorite musical instrument.

1) Which instrument got the most votes?
2) Which instrument got five votes?
3) How many more votes did the guitar have than the drums?
4) How many votes did the piano and flute have together?
Problem 5 :
Four friends prepared hotdogs for their picnic day.
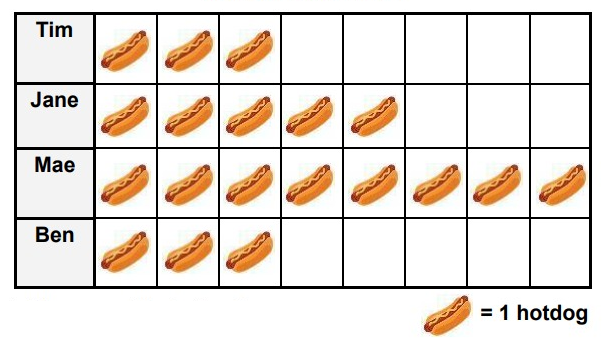
1) Who prepared five hotdogs?
2) Who prepared the most hotdogs?
3) How many hotdogs did Ben prepare?
4) Which 2 friends prepared the same number of hotdogs?
5) How many hotdogs were prepared by Mae and Ben?
Problem 6 :
The pictograph shows the number of games each team in a volleyball league won during one season.
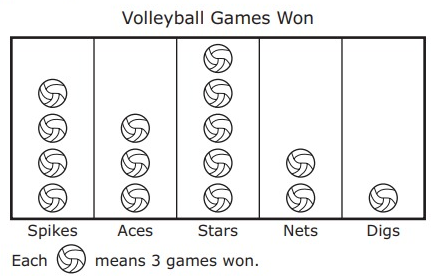
Create the table represents the data in the pictograph?
Problem 7 :
Kathy baked cupcakes from Monday to Friday for her friends. Use the information to answer the questions.
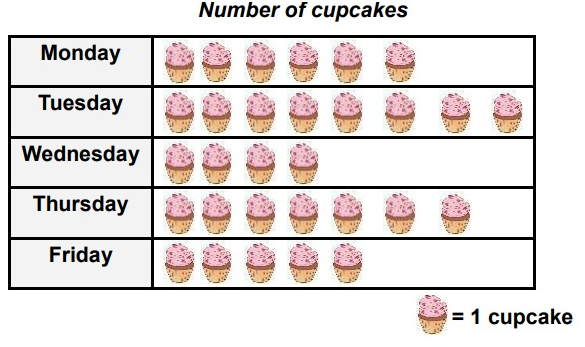
1) How many cupcakes did Kathy bake on Friday?
2) On what day did she bake 7 cupcakes?
3) On what day did she bake the fewest cupcakes?
4) On what day she bake the most cupcakes?
5) How many cupcakes did she bake on Thursday and Friday together?
Problem 8 :
Sam and his friends collect baseball cards. This picture graph shows how many cards they have.
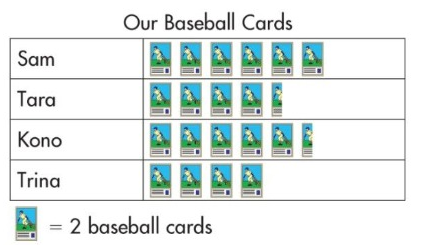
Use the picture graph to answer the questions.
1) How many cards do the friends have in all? _____
2) How many cards does Sam have? _____
3) Who has the fewest cards? _____
4) How many cards does kono have? _____
5) How many cards do Tara and Trina have together?
6) How many more cards do Tara and Trina have together compared to Sam? _____
Problem 9 :

1) Who read the most? _____
2) How much more did Eric read than Carol? _____
3) How many books did Sue read? _____
4) How much less did Manny read than Sue? _____
5) Who read the least? _____
6) How many books did they read in total? _____
Subscribe to our ▶️ YouTube channel 🔴 for the latest videos, updates, and tips.
Recent Articles
-
Finding Range of Values Inequality Problems
May 21, 24 08:51 PM
Finding Range of Values Inequality Problems -
Solving Two Step Inequality Word Problems
May 21, 24 08:51 AM
Solving Two Step Inequality Word Problems -
Exponential Function Context and Data Modeling
May 20, 24 10:45 PM
Exponential Function Context and Data Modeling