PROBLEMS ON FREQUENCY TABLE WITH TYPES OF SKEWED DATA
Subscribe to our ▶️ YouTube channel 🔴 for the latest videos, updates, and tips.
Problem 1 :
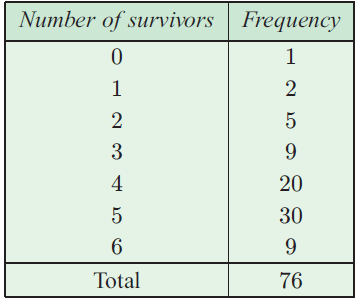
Hui breeds ducks. The number of ducking survying for each pair after one month is recorded in the table,
a) Calculate the
i) Mean ii) Median iii) Mode iv) Range

b) Is the data skewed
c) How does the skewness of the data affect the measures of the middle of the distribution?
Solution :
a) i) Mean
= [0(1) + 1(2) + 2(5) + 3(9) + 4(20) + 5(30) + 6(9)]/76
= (0 + 2 + 10 + 27 + 80 + 150 + 54)/76
= 323/76
= 4.25
ii) Median
N = 76, N/2 ==> 38
|
Survivors 0 1 2 3 4 5 6 |
Frequency 1 2 5 9 20 30 9 |
Cumulative frequency 1 3 8 17 37 57 66 |
Median = (5 + 5)/2
= 5
iii) Mode = 5 is repeating 30 times. So, mode = 5
iv) Range :
= 6 - 0
= 6
b) The mean is negatively skewed
c) The mean is less than the mode and median.
Problem 2 :
A class of 20 students was asked " How many children are there in your household " ? and the following data was collected
1 2 3 3 2 4 5 4 2 3 8 1 2 1 3 2 1 2 1 2
a) What is the variable in the investigation ?
b) Is the data discrete or continuous ? Explain you answer.
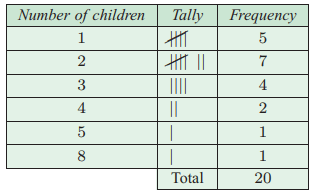
c) Construct a frequency table for the data.
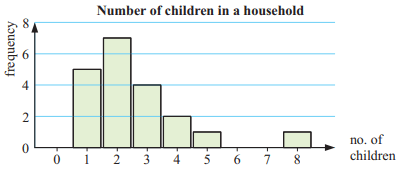
d) Construct vertical bar chart to display data
e) how would you describe the distribution of the data ? IS is symmetrical or positively or negatively skewed ?
f) What is the mode of the data ?
Solution :
By creating a frequency table, we can handle the data little easily.
1 2 3 3 2 4 5 4 2 3 8 1 2 1 3 2 1 2 1 2
|
Number of children 1 2 3 4 5 8 |
Number of families have 5 7 4 2 1 1 |
a) Number of children per household.
b) This given data is discrete.
c)

d) Horizontal axis - number of children
Vertical axis - number of household

e) It is not symmetrical data, it is positively skewed data.
f) 7 is the highest frequency. 7 families has 2 children in their household. So, mode is 2.
Problem 3 :
The given table shows the distribution of scores for a year 10 spelling test in Austria
a) Calculate the
i) Mean ii) Mode iii) Median iv) Range
|
Score 6 7 8 9 10 Tatal |
Frequency 2 4 7 12 5 30 |
b) The average score for all year 10 students across Austria in this spelling test was 6.2. How does this class compare to the national average ?
c) Is the data is skewed. Is the skewness positive or negative ?
Solution :
a)
i) Mean = Sum of all values / Total
= [6(2) + 7(4) + 8(7) + 9(12) + 10(5)]/30
= (12 + 28 + 56 + 108 + 50)/30
= 254/30
= 8.47 (approximately)
ii) Median, N = 30 (Even)
Average of 15 and 16th values. To find these elements, we will create cumulative frequency table.
|
Score 6 7 8 9 10 Tatal |
Frequency 2 4 7 12 5 30 |
Cumulative frequency 2 6 13 25 30 |
15th and 16th elements are 9 and 9 respectively. So, median = 9.
iii) Mode
12 is the highest frequency, the score 9 is repeating 12 times. So, mode is 12.
iv) Range :
Greatest value = 10, least value = 6
Range = 10 - 6
= 4
b) Given that, the average score for all year 10 students across Austria in this spelling test was 6.2.
Average in Austria = 8.47
So, comparing these two data average in Austria is greater than average across Austria.
c) Median and mode are greater than mean. So, the distribution is negatively skewed.
Problem 4 :
20 students were asked "How many TV sets do you have in your household? and the following data was collected :
2 1 0 3 1 2 1 3 4 0 0 2 2 0 1 1 0 1 0 1
a) What is the variable in this investigation ?
b) Is the data discrete or continuous ? why ?
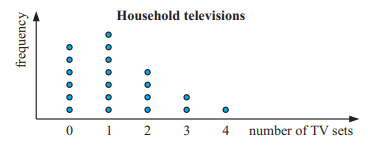
c) Construct a dot plot to display the data. Use a heading for the graph, and scale and label the axis.
d) how do you describe the distribution of the data (is this symmetrical, positively skewed or negatively skewed ? Are they any outliers ?)
e) What percentage of the households had no TV sets ?
f) What percentage of the house holds had three or more TV sets ?
Solution :
a) Number of TV sets per household.
b) Since number of TV sets must be an integer, It is discrete.
c)

d) The data is positively skewed. No outliers.
e) Number of households has no TV sets = 6
Converting into percentage = (6/20) x 100%
= 0.3 x 100%
= 30%
f)
Number of households have 3 or more = 3
Converting into percentage = (3/20) x 100%
= 15%
Subscribe to our ▶️ YouTube channel 🔴 for the latest videos, updates, and tips.
Recent Articles
-
Finding Range of Values Inequality Problems
May 21, 24 08:51 PM
Finding Range of Values Inequality Problems -
Solving Two Step Inequality Word Problems
May 21, 24 08:51 AM
Solving Two Step Inequality Word Problems -
Exponential Function Context and Data Modeling
May 20, 24 10:45 PM
Exponential Function Context and Data Modeling