PRACTICE PROBLEMS ON LINE GRAPH
Subscribe to our ▶️ YouTube channel 🔴 for the latest videos, updates, and tips.
Problem 1 :
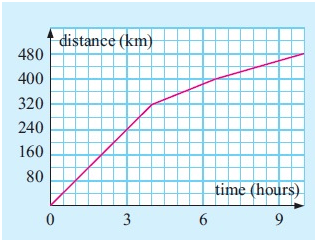
The graph alongside indicates the distance a homing pigeon travelled from its point of release until it reaches its home.
Use the graph to determine:
a. The total length of the flight
b. The time taken for the pigeon to reach home
c. The time taken to fly the first 200 km
d. The time taken to fly the from the 240 km mark to the 400 km mark
e. The average speed for the first 4 hours
f. The average speed for the whole flight
Problem 2 :
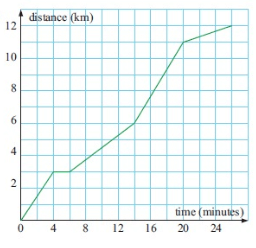
The graph alongside indicates the distance a cyclist must travel to work. Use the graph to determine:
a. The distance to work
b. The time taken to get to work
c. The distance travelled after
i) 10 minutes ii) 17 minutes
d. The time taken to travel
i. 6 km
ii.10 km
e. The average speed for the whole distance.
Problem 3 :
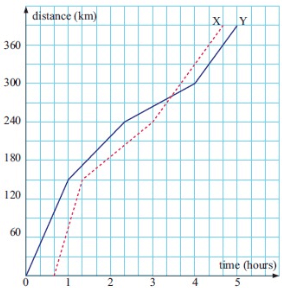
Two rally cars were involved in a handicap time trial. The distance time graph indicates how far each has travelled.
Use the graph to determine:
a. The handicap advantage given to car Y
b. The distance travelled by each car
c. How far both cars had travelled when car X caught car Y
d. How long it took each car to travel 300 km
e. How much faster X completed the time trial than Y
f. The average speed of each car.
Problem 3 :
This graph shows the height of a balloon at different times.

a) From the graph, find the height of the balloon at 50 seconds.
b) Use the graph to find how long it took the balloon to rise from 30 meters to 60 meters.
Problem 5 :
This graph shows how the temperature changed in Liam’s room one afternoon

a) Estimate the temperature at 3:15 pm.
b) Estimate the time when the temperature was highest.
c) How much did the temperature change from 2 pm to 2:30 pm? Give your answer to the nearest degree.
Problem 5 :
150 people take part in a walk. This chart shows the number of people still walking at different times. 150 people take part in a walk. This chart shows

a) Use the chart to estimate the time when two-thirds of the people are still on the walk.
b) What percentage of the people who started are still on the walk at 3pm? What percentage of the people
Problem 6 :
This graph shows the temperature in a greenhouse.

a) Use the graph to find the time when the temperature was 25°C.
b) Use the graph to find the difference between the temperature at 2pm and the temperature at 4pm.
Answer Key
1)
a. Length of flight is 480 km.
b. Time to reach home is 10 hours.
c. Time taken for 200 km = 2.5 hours.
d. It takes 3 1/2 hours to fly from 240 km to 400 km.
e. Average speed = 320/4 = 80 km per hour.
f. Average speed = 480/10 = 48 km per hour.
2)
a. The distance to work is 12 km.
b. Time taken to get to work is 26 km.
c.
i. The distance travelled after 10 minute is 4.5 km
ii. The distance travelled after 17 minute is 8.5 km
d.
i. The time taken to travel 6 km is 14 minutes
ii. The time taken to travel 10 km is 18.8 minutes
e. Average speed = 27.7 km per hour
3)
a. the handicap advantage given to car Y is 40 minutes.
b. The distance travelled by each car is 390 km.
c. Far of both cars is approximately 280 km.
d. X car : 3 hours
Y car : 4 hours
e. 1 hour faster X completed the time trial than Y.
f. X car :
Average speed = 97.5 km per hour
Y car :
Average speed = 78 km per hour
4)
a) The height of balloon is 47 m when it is at 50 seconds.
b) 55 seconds
5)
a) The temperature is 22.5°C at 3:15 pm.
b) The temperature was highest at 2.48 pm.
c) 5.1°C
6)
a) 100
b) 20%
7)
a) The time is 3.15 pm when the temperature was 25°C
b) At 2 pm,
- the temperature is 20°C
- the temperature is 33°C
the difference = 33 - 20
= 13°C
Problem 1 :
Below is a line graph that shows how many books are sold in a charity shop over one week.
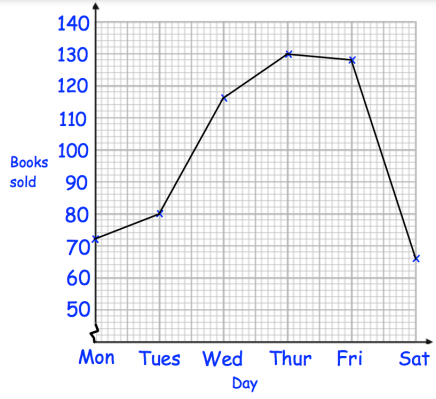
(a) On which day did the charity shop sell the most books?
(b) On which day did the charity shop sell the least books?
(c) How many books were sold on Tuesday?
Problem 2 :
Below is a line graph that shows the population of a village.
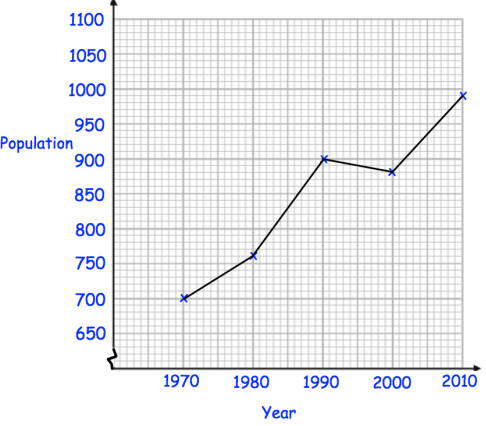
(a) What was the population in 1980?
(b) In which year was the population 700?
Problem 3 :
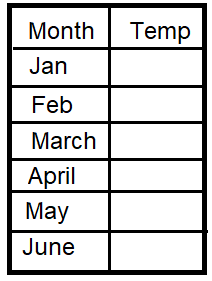
Analyze the line graph, complete the data table and answer the questions.
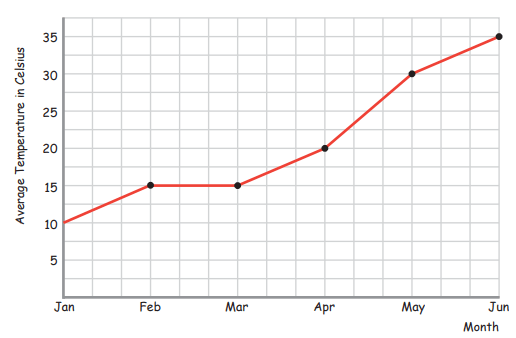
1) Complete the data table
2) In which month was the average temperature 30 degrees Celsius?
3) In which 2 months was the average temperature the same?
4) In which months was the average temperature higher than 20 degrees?
5) How much did the average temperature increase between January and April?
Problem 4 :
This graph shows the temperature in °C from 2 am to 3 pm on a cold day

a) How many degrees warmer was it at 3 pm than at 3 am?
b) At 6 pm the temperature was 4 degrees lower than at 3 pm. What was the temperature at 6 pm?
Problem 5 :
This graph shows the height of a balloon at different times.

a) From the graph, find the height of the balloon at 50 seconds.
b) Use the graph to find how long it took the balloon to rise from 30 meters to 60 meters
Problem 6 :
This chart shows the population of Cornwall from 1950 to 2010.

a) In which year did the population first reach 400000?
b) How much did the population increase from 1950 to 2000?
c) What was the population of Cornwall in 2010?
Problem 7 :
This graph shows the outside temperature from 4pm to 10pm on a day in winter.

a) At what time was the temperature –2°C?
b) How many degrees did the temperature drop from 5 pm to 7 pm?
Problem 8 :
This graph shows how the weight of a baby changed over twelve months.

a) From the graph, what was the weight of the baby at 10 months?
b) How much more did the baby weigh at 5 months than at birth?
Problem 9 :
This chart gives the cost of showing advertisements on television at different times.

a) An advertisement lasts 25 seconds. Use the graph to estimate how much cheaper it is to show it in the daytime compared with the evening.
An advertisement was shown in the daytime and again in the evening.
The total cost was £1200
b) How long was the advertisement in seconds?
Problem 10 :
This graph shows the cost of phone calls in the daytime and in the evening.

a) How much does it cost to make a 9 minute call in the daytime?
b) How much more does it cost to make a 6 minute call in the daytime than in the evening?
Answer Key
1)
a) By observing the graph, on Thursday most number of books sold out.
b) On Saturday, least number of books sold out.
c) On Tuesday, 80 books were sold out.
2)
a) On 1980, the population is 750.
b) On 1970 the population was 700.
3)

2) On the month of May, the average temperature 30 degrees Celsius
3) In the months February and March, the average temperatures are same.
4) The average average temperature in the month of May and June are more than 20 degree.
5) Increase between Jan and April is 20 - 10 = 10
4) a) on that cold day the temperature is 7°C warmer at 3 pm than at 3 am.
b) -2°C
5) a) the height of the balloon 47 m at 50 seconds.
b) 25 seconds
6) a) The population reaches 400000 at 1985.
b) 150000
c) Population of Cornwall in 2010 = 510000
7) a) At 8.45 pm the temperature –2°C
b) the temperature drops 3°C.
8) a) Weight of baby at 10 months is 8.75 kg.
b) 3.25 kg
9)
For 25 minutes advertisement,
- the cost is $575 in the day time
- the cost is $1100 in the evening
b) For $1200, the length of advertisement is 30 seconds.
10) a) The cost of 9 minute call in the day time is 47 p
b) 20 p
Subscribe to our ▶️ YouTube channel 🔴 for the latest videos, updates, and tips.
Recent Articles
-
Finding Range of Values Inequality Problems
May 21, 24 08:51 PM
Finding Range of Values Inequality Problems -
Solving Two Step Inequality Word Problems
May 21, 24 08:51 AM
Solving Two Step Inequality Word Problems -
Exponential Function Context and Data Modeling
May 20, 24 10:45 PM
Exponential Function Context and Data Modeling