PLOTTING POINTS FROM A TABLE OF VALUES WORKSHEET
Subscribe to our ▶️ YouTube channel 🔴 for the latest videos, updates, and tips.
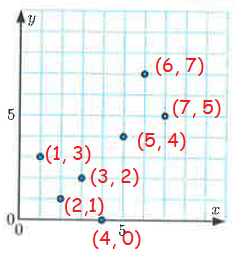
1) Mike kept a record of the cars sold at his car yard each day last week :
|
Day number (x) 1 2 3 4 5 6 7 |
Cars Sold (y) 3 1 2 0 4 7 5 |
Plot these points on the number plane.
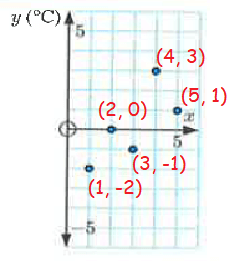
2) While on Ski camp, Ned recorded the minimum temperature reached each night. The results are given in the table below.
|
Night number (x) 1 2 3 4 5 |
Temperature (y ° C) -2 0 -1 3 1 |
Plot these points on a number plane.
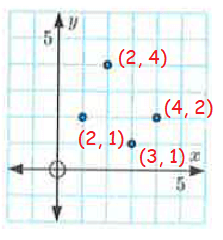
3) For each of the following tables of values, plot the points on the number line.
|
x 1 2 3 4 |
y 2 4 1 2 |
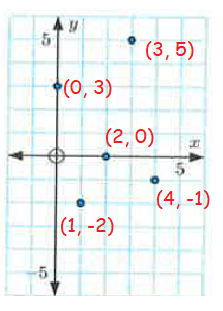
4)
|
x 0 1 2 3 4 |
y 3 -2 0 5 -1 |
5)
|
x -3 -1 0 2 3 |
y 4 2 -1 4 -2 |
6)
|
x -2 -1 0 1 2 |
y 3 0 2 -4 -3 |
7)
a) Plot the points for this table of values on the number plane.
|
x -3 -1 0 2 3 |
y 0 2 3 5 6 |
b) What do you notice about these points ?
c) Can you see a relationship between the x and y-coordinate of these points ?
8) The height of a plant is recorded on weekly basis
|
Week number (x) 1 2 3 4 5 |
Height (y cm) 6 9 11 13 14 |
9) Tina measured the rainfall at her house each day for 5 days. Her result are shown below.
|
Day number (x) 1 2 3 4 5 |
Rainfall (y mm) 5 2 9 0 4 |
Plot these points on a set of axes.
Detailed Solution
Problem 1 :
|
Day number (x) 1 2 3 4 5 6 7 |
Cars Sold (y) 3 1 2 0 4 7 5 |
Solution :
Inputs are values of x and outputs are values of y. Every point will be written in the form of (x, y).
(1, 3) (2, 1) (3, 2) (4, 0) (5, 4) (6, 7) and (7, 5)
Problem 2 :
|
Night number (x) 1 2 3 4 5 |
Temperature (y ° C) -2 0 -1 3 1 |
Solution :
Night number is input, temperatures are output.
Inputs are values of x and outputs are values of y. Every point will be written in the form of (x, y).
(1, -2) (2, 0) (3, -1) (4, 3) and (5, 1)
Problem 3 :
|
x 1 2 3 4 |
y 2 4 1 2 |
Solution :
Inputs are values of x and outputs are values of y.
Writing the given set of inputs and outputs as set of ordered pairs, we get
(1, 2) (2, 4) (3, 1) and (4, 2).
Problem 4 :
|
x 0 1 2 3 4 |
y 3 -2 0 5 -1 |
Solution :
Input values are x and output values are y. By writing the inputs and outputs as set of ordered pairs, we get
(0, 3) (1, -2) (2, 0) (3, 5) and (4, -1)
Problem 5 :
|
x -3 -1 0 2 3 |
y 4 2 -1 4 -2 |
Solution :
By writing the inputs and outputs as set of ordered pairs, we get
(-3, 4) (-1, 2) (0, -1) (2, 4) and (3, -2)

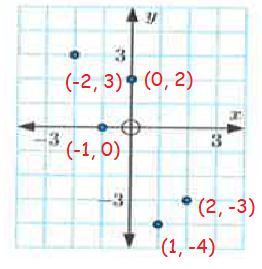
Problem 6 :
|
x -2 -1 0 1 2 |
y 3 0 2 -4 -3 |
Solution :
Writing the given inputs as set of ordered pairs, we get
(-2, 3) (-1, 0) (0, 2) (1, -4) and (2, -3)
Problem 7 :
|
x -3 -1 0 2 3 |
y 0 2 3 5 6 |
Solution :
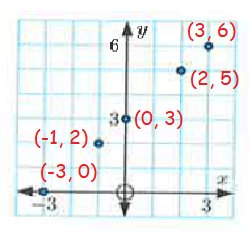
a) We notice that the points lie on the straight line.
b) Here y values are 3 more than the values of x.
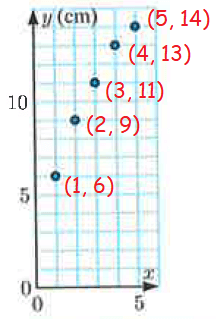
Problem 8 :
The height of a plant is recorded on weekly basis
|
Week number (x) 1 2 3 4 5 |
Height (y cm) 6 9 11 13 14 |
Solution :
Writing the inputs and outputs as set of ordered pairs, we get
(1, 6) (2, 9) (3, 11) (4, 13) and (5, 14)
Problem 9 :
|
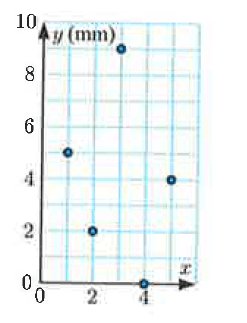
Day number (x) 1 2 3 4 5 |
Rainfall (y mm) 5 2 9 0 4 |
Plot these points on a set of axes.
Solution :
Writing the inputs and outputs as set of ordered pairs, we get
(1, 5) (2, 2) (3, 9) (4, 0) and (5, 4)
Subscribe to our ▶️ YouTube channel 🔴 for the latest videos, updates, and tips.
Recent Articles
-
Finding Range of Values Inequality Problems
May 21, 24 08:51 PM
Finding Range of Values Inequality Problems -
Solving Two Step Inequality Word Problems
May 21, 24 08:51 AM
Solving Two Step Inequality Word Problems -
Exponential Function Context and Data Modeling
May 20, 24 10:45 PM
Exponential Function Context and Data Modeling