MODELLING WITH LINEAR FUNCTIONS
Subscribe to our ▶️ YouTube channel 🔴 for the latest videos, updates, and tips.
Problem 1 :
Which chart could represent the function f(x) = -2x + 6?

Solution:
1) For the first chart:
-2 × 0 + 6 = 6 = 6
-2 × 2 + 6 = 2 ≠ 10
-2 × 4 + 6 = -2 ≠ 14
-2 × 6 + 6 = -6 ≠ 18
2) For the second chart:
-2 × 0 + 6 = 6 ≠ 4
-2 × 2 + 6 = 2 ≠ 6
-2 × 4 + 6 = -2 ≠ 8
-2 × 6 + 6 = -6 ≠ 10
3) For the third chart:
-2 × 0 + 6 = 6 ≠ 8
-2 × 2 + 6 = 2 ≠ 10
-2 × 4 + 6 = -2 ≠ 12
-2 × 6 + 6 = -6 ≠ 14
4) For the fourth chart:
-2 × 0 + 6 = 6 = 6
-2 × 2 + 6 = 2 = 2
-2 × 4 + 6 = -2 = -2
-2 × 6 + 6 = -6 = -6
The fourth chart could represent the function.
So, option (4) is correct.
Problem 2 :
Which equation expresses the relationship between a and y, as shown in the accompanying table?

1) y = x + 3 2) y = 2x + 3 3) y = 3x + 2 4) y = x + 2
Solution:
Let equation is y = mx + c
Substitute the values of x and y
(x, y) = (0, 2) ==> 2 = m(0) + c
c = 2
(x, y) = (1, 5) ==> 5 = m(1) + c
5 = m + c
5 = m + 2
m = 3
So, equation is y = 3x + 2
So, option (3) is correct.
Problem 3 :
If x and y are defined as indicated by the accompanying table, which equation correctly represents the relationship between x and y?

1) y = x + 2 2) y = 2x + 2 3) y = 2x + 3
4) y = 2x - 3
Solution:
1)
If x = 2,
y = 2 + 2
y = 4
It is false.
2)
If x = 2,
y = 2(2) + 2
y = 6
It is false.
3)
If x = 2
y = 2(2) + 3
y = 7
It is false.
4)
If x = 2
y = 2(2) - 3
y = 1
It is true.
So, option (4) is correct.
Problem 4 :
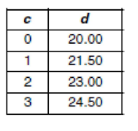
Which linear equation represents the data in the accompanying table?

1) d = 1.50c 2) d = 1.50c + 20.00 3) d = 20.00c + 1.50
4) d = 21.50c
Solution:
The linear equation y = mx + c
d = kc + b
k = (21.5 - 20)/(1 - 0)
= 1.5
(0, 20)
b = 20
d = 1.50c + 20.00
So, option (2) is correct.
Problem 5 :
Each day Toni records the height of a plant for her science lab. Her data are shown in the table below.

The plant continues to grow at a constant daily rate. Write an equation to represent h(n), the height of the plant on nth day.
Solution:
h(n) = 1.5(n - 1) + 3.0
= 1.5n - 1.5 + 3.0
h(n) = 1.5n + 1.5
Problem 6 :
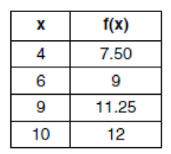
Tanya is making homemade greeting cards. The data table below represents the amount she spends in dollars, f(x), in terms of the number of cards she makes, x.

Write a linear function, f(x), that represents the data. explain what the slope and y-intercept of f(x) mean in the given context.
Solution:
1)
f(x) = kx + b
b = f(x) - kx
= 7.50 - 4(0.75)
= 4.50
f(x) = 4.50 + 0.75x
2)
k = 0.75x means per cards is 0.75 dollars.
b = 4.50 means cost price.
Problem 7 :
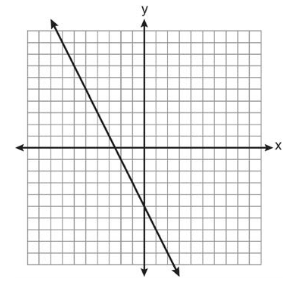
Which equation is represented by the graph below?

1) 2y + x = 10 2) y - 2x = -5 3) -2y = 10x - 4
4) 2y = -4x - 10
Solution:
x intercept = (-2.5, 0)
y intercept = (0, -5)
So, option (4) is correct.
Problem 8 :
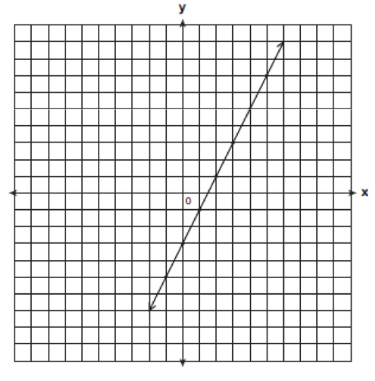
Write the equation for the line shown in the accompanying graph. Explain your answer.

Solution:
y = 2x - 3
The y- intercept is -3.
The line has a slope of 2.
The equation for the line is y = 2x - 3.
Subscribe to our ▶️ YouTube channel 🔴 for the latest videos, updates, and tips.
Recent Articles
-
Finding Range of Values Inequality Problems
May 21, 24 08:51 PM
Finding Range of Values Inequality Problems -
Solving Two Step Inequality Word Problems
May 21, 24 08:51 AM
Solving Two Step Inequality Word Problems -
Exponential Function Context and Data Modeling
May 20, 24 10:45 PM
Exponential Function Context and Data Modeling