MEAN MEDIAN MODE FROM BAR GRAPH
Subscribe to our ▶️ YouTube channel 🔴 for the latest videos, updates, and tips.
Problem 1 :
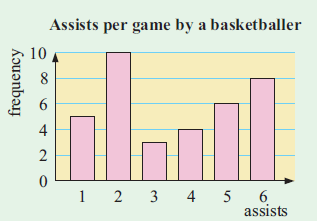
Using the frequency column graph below :
a) Construct a frequency table
b) Determine the total number of assists.
c) for the assists given, find the
i) Mean ii) Median iii) Mode
Solution :
a)
|
Assists 1 2 3 4 5 6 |
Frequency 5 10 3 4 6 8 |
b) Total number of assists = 5 + 10 + 3 + 4 + 6 + 8
= 36
c) Mean = [1(5) + 2(10) + 3(3) + 4(4) + 5(6) + 6(8)]/36
= (5 + 20 + 9 + 16 + 30 + 48)/36
= 128/36
= 3.56
Median :
Since the number of quantities is even,
median = (36/2 + 36/2 + 1)/2
= (18th + 19th) entries / 2
= (3 + 4) / 2
= 7/2
= 3.5
Mode :
The most repeated value is 2. So, mode is 2.
Problem 2 :
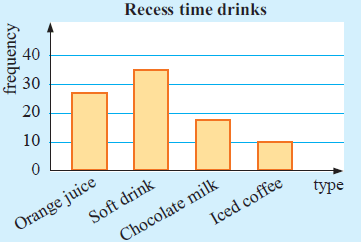
The graph given shows the types of drink purchased by students at recess
a) What is the least popular drink ?
b) What is the mode of the data ?
c) How many drink orange juice ?
d) What percentage of students drink chocolate milk ?
Solution :
Number of students who drink orange juice = 27
Number of students who prefer soft drink = 35
Number of student who prefer chocolate milk = 18
Number of students who prefer iced coffee = 10
a) So, the least popular drink = 10
b) Soft drink is having the highest frequency. So, mode is 35.
c) 27 students are drinking orange juice.
d) 18 students are preferring chocolate milk.
Total purchase = 27 + 35 + 18 + 10
= 90
Required percentage = (18/90) x 100%
= 20%
Problem 3 :
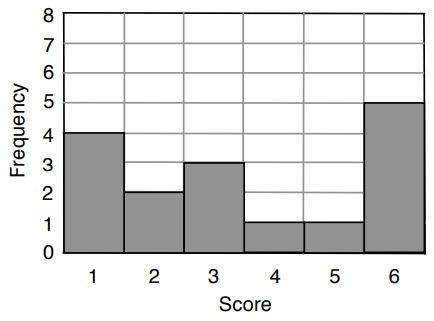
The bar chart represents the outcome of a penalty shoot-out competition. Each person in the competition was allowed six shots at the goal. The graph shows, for example, that four people only scored one goal with their six shots.
a) How many people were involved in the shoot-out?
b) Find the Mean, Median, Mode, and Range of scores.
Solution :
a) Number of people involved = 4 + 2 + 3 + 1 + 1 + 5
= 16
b) 1 is repeated 4 times
2 is repeated 2 times
3 is repeated 3 times
4 is repeated 1 time
5 is repeated 1 time
6 is repeated 5 times.
1, 1, 1, 1, 2, 2, 3, 3, 3, 4, 5, 6, 6, 6, 6, 6
(i) Mean :
Total score = 1(4) + 2(2) + 3(2) + 4(1) + 5(1) + 6(5)
= 4 + 4 + 6 + 4 + 5 + 30
= 53
Total number of scores = 16
Mean score = 53/16
= 3.3
Median :
1, 1, 1, 1, 2, 2, 3, 3, 3, 4, 5, 6, 6, 6, 6, 6
Number of scores = 16
median score = 16/2
= 8th score
Median score = 3
Mode :
The most repeated element is 6. So, mode is 6.
Range :
Greatest score = 6, least score = 1
Range = 6 - 1
Range = 5
Problem 4 :
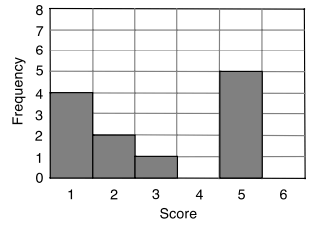
The bar chart represents the scores from a quiz. Children were asked to name six boy bands in 30 seconds. Each score represents the number of correctly named bands.
a) How many children were involved in the quiz?
b) Complete the table with values for the Mean, Median, Mode, and Range of scores.
Solution :
|
Number of students 4 2 1 5 |
Their score 1 2 3 5 |
a) Number of students = 4 + 2 + 1 + 5 ==> 12 students
b) Mean :
Mean score = Total score / total number of score
Total score = [1(4) + 2(2) + 3(1) + 5(5)]
= 4 + 4 + 3 + 25
= 36
Total number of score = 12
= 36/12
= 3
Median :
Writing the data as list, we get
1, 1, 1, 1, 2, 2, 3, 5, 5, 5, 5, 5
Number of scores = 12
Median score = (12 + 1)/2 th score
= 6th score
= 2
So, 2 is the median score.
Mode :
Most repeated score is 5.So, mode is 5.
Range :
= 5 - 1
= 4
Problem 5 :
Using the bar chart given below
a) Construct a frequency table
b) Determine the total number of
i) game played ii) goals scored
c) Find the
i) mean ii) Median iii) Mode iv) Range

Solution :
a) Frequency table :
|
Number of goals 0 1 2 3 |
Frequency 8 7 4 1 |
b) Total number of game played = 8 + 7 + 4 + 1
= 20 games
ii) goals scored = 1(7) + 2(4) + 3(1)
= 7 + 8 + 3
= 18 goals.
c)
i) mean = Total number of games played / total number of goals
= [0(8) + 1(7) + 2(4) + 3(1)]/20
= (7 + 8 + 3)/20
= 18/20
= 0.9
ii) Median = (N+1)/2 th term
= 21/2
= 10.5 th term
approximately 10th term is the median.
1 is the median.
iii) Mode = Most repeating value is 0. So, 0 is the mode.
iv) Range = 3 - 0
= 3 is the range.
Subscribe to our ▶️ YouTube channel 🔴 for the latest videos, updates, and tips.
Recent Articles
-
Finding Range of Values Inequality Problems
May 21, 24 08:51 PM
Finding Range of Values Inequality Problems -
Solving Two Step Inequality Word Problems
May 21, 24 08:51 AM
Solving Two Step Inequality Word Problems -
Exponential Function Context and Data Modeling
May 20, 24 10:45 PM
Exponential Function Context and Data Modeling