MEAN MEDIAN MODE DOT PLOT WORKSHEET
Subscribe to our ▶️ YouTube channel 🔴 for the latest videos, updates, and tips.
Problem 1 :
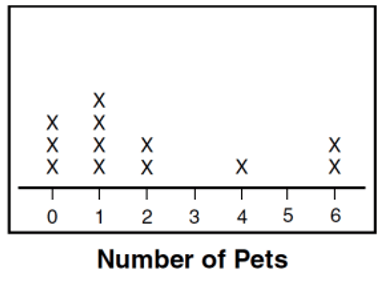
Use the line plot. Find the
(i) Mean (ii) Median (iii) Mode and (iv) Range
of the data.
Problem 2 :
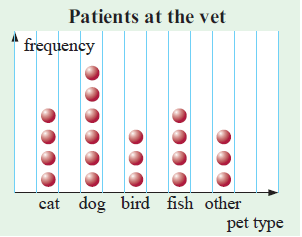
The dot plot shows the types of pets treated at a vet on one day.
a) How many pets were treated on this day?
b) Find the mode of the data.
c) What percentage of the pets treated were fish?
b) 100 plus is the mode.
Problem 3 :
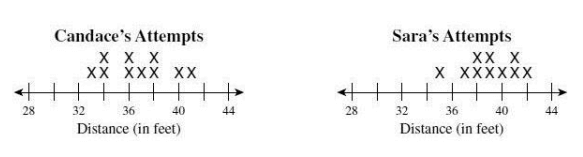
Four girls on a high school track and field team practice the shot put. Each girl made 10 attempts, and the distances measure after each attempt are shown on the plots below.
a) Which girl’s range of
distance was the greatest?
Problem 4 :
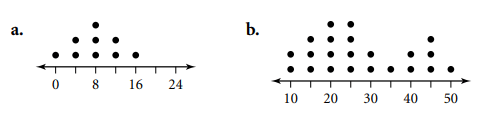
Find the mean, median, and mode of each dot plot.
Problem 5 :
A teacher drew a line segment that was 20 inches long on the blackboard. She asked each of her students to estimate the length of the segment and used their estimates to draw this dot plot.
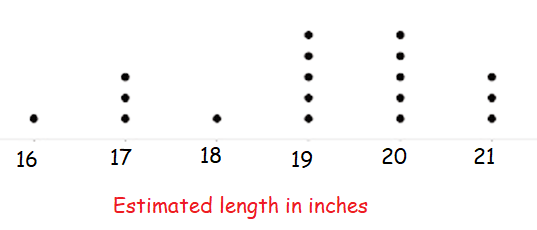
a. How many students were in the class?
b. Were students generally accurate in their estimates of the length of the line? Explain your reasoning.
Problem 6 :
Determine if each statement is true or false.
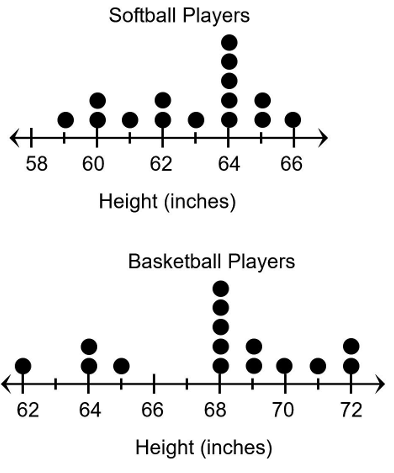
a) The range of the data for the heights of softball players is less than the range of the data for the heights of basketball players.
b) The median of the data for the heights of softball players is greater than the median of the data for the heights of basketball players
Answer Key
1) mean number of pets is 2.
Median = 1
Mode = 1
Range = 6
2) a) total number of pets treated is 20.
b) Mode of the data is dog.
c) 20%
3) a)
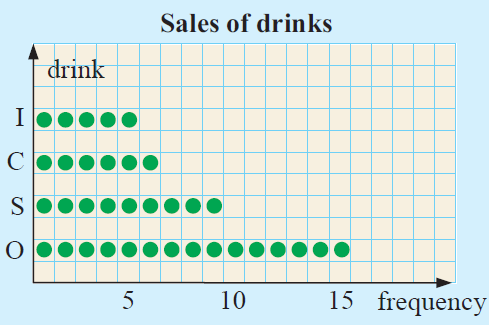
b) b) 100 plus is the mode
4) Candance's attempts has greatest attempts of distance.
5) Mean = 8, Median = 8, Mode = 3.
b) Mean = 22.95, median = 25, mode = 20 and 25 are modes
6) a) total number of students is 18.
b) estimated length of line is 19 inches.
7) a) True
b) False
Problem 1 :
Martha conducted a random survey during lunch. She asked 20 students and 20 teachers how many siblings they have. The survey data are represented in the dot plots below. Based on the data in the dot plots, fill in the blanks to create a true statement.comparingdotplotq1.png
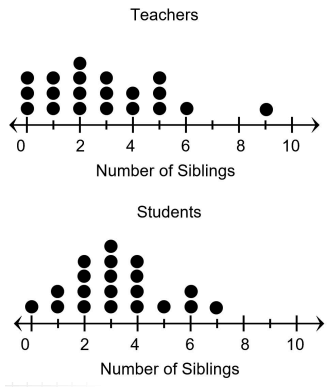
1) The range of the data for the survey results for teachers is _________ than the range of the data for the survey results for the students.
2) The mode of the data for the survey results for teachers is _________ than the mode of the data for the survey results for the students.
3) The data for the survey for _________ is more symmetrical than the data for the survey for _________.
4) The median of the data for the survey results for teachers is _________ than the median of the data for the survey results for the students.
5) The greatest number of siblings for teachers is _________ than the greatest number of siblings for students.
Problem 2 :
Use the following information for questions. Determine if each statement is true or false.
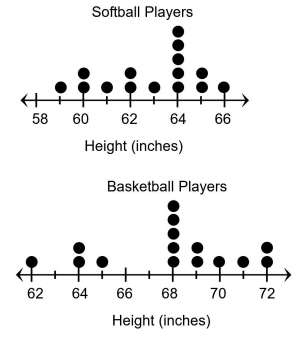
1) The range of the data for the heights of softball players is less than the range of the data for the heights of basketball players.
2) The median of the data for the heights of softball players is greater than the median of the data for the heights of basketball players.
Problem 3 :
The dot plots below represent two sets of data.
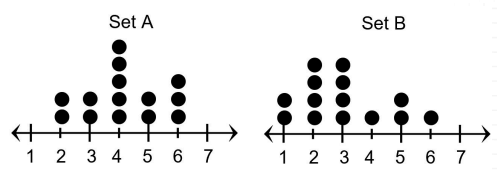
Here are three statements about the data.
I. The mode of the data in Set A is equal to the mode of the data in Set B.
II. The range of the data in Set A is less than the range of the data in Set B.
III. The median of the data in Set A is greater than the median of the data in Set B.
Which of these three statements appear to be true?
F I only G I and II H II and III J III only
Problem 4 :
The teacher recorded the number of words that her students could type per minute at the beginning of a course and again at the end. The two dot plots show the two data sets.
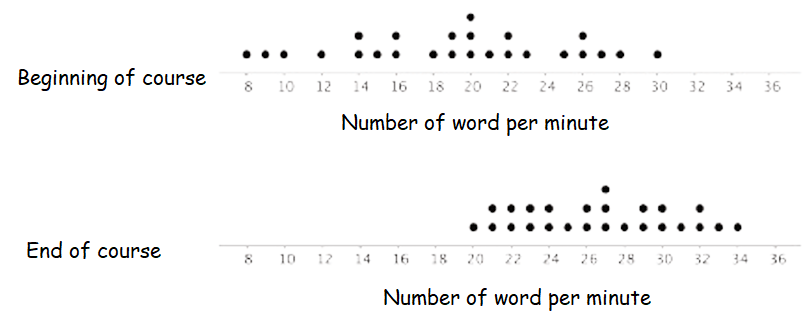
a. Overall, the students typing speed did not improve. They typed at the same speed at the end of the course as they did at the beginning.
b. 20 words per minute is a good estimate for how fast, in general, the students typed at the beginning of the course.
c. 20 words per minute is a good description of the enter of the data set at the end of the course.
Answer Key
1)
1) greater
2) lesser
3) students, teachers
4) lesser
5) lesser
2) 1) True 2) False
3) III only true.
4) a) the given statement is wrong. At the end of the course the speed is improved.
b) At the beginning of the course 3 students typed 20 words per minute
c) At the end of the course 1 student types 20 words per minute
Subscribe to our ▶️ YouTube channel 🔴 for the latest videos, updates, and tips.
Recent Articles


-
Finding Range of Values Inequality Problems
May 21, 24 08:51 PM
Finding Range of Values Inequality Problems -
Solving Two Step Inequality Word Problems
May 21, 24 08:51 AM
Solving Two Step Inequality Word Problems -
Exponential Function Context and Data Modeling
May 20, 24 10:45 PM
Exponential Function Context and Data Modeling