MAXIMUM AND MINIMUM VALUES FROM STEM AND LEAF PLOT WORKSHEET
Subscribe to our ▶️ YouTube channel 🔴 for the latest videos, updates, and tips.
Problem 1 :
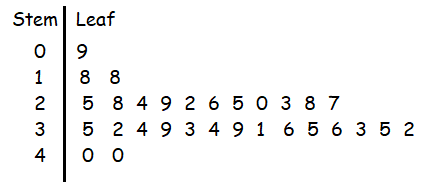
The test score out of 40 marks was recorded for a group of 30 students:
25 18 35 32 34 28 24 39 29 33
22 34 39 31 36 35 36 33 35 40
26 25 20 18 9 40 32 23 28 27
a) Construct a stem-and-leaf plot for this data using 0, 1, 2, 3 and 4 as the stems.
b) Redraw the stem-and-leaf plot so that it is ordered.
c) What advantage does the stem-and-leaf plot have over a frequency table?
d) What was the
i. highest
ii. lowest mark scored for the test?
e) If an 'A' was awarded to students who scored 36 or or more for the test, what percentage of students scored an 'A'?
Problem 2 :
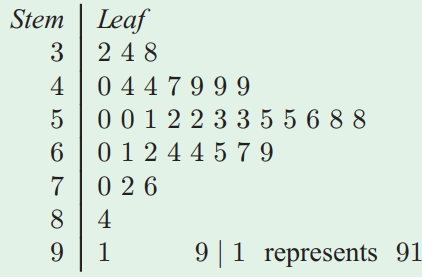
For the following sample of weights (in kg) of year 10 students, find:
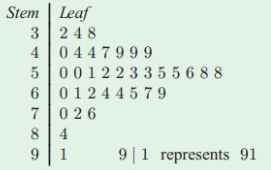
a) the minimum weight
b) the maximum weight
c) the number of students with a weight greater than 52 kg
d) the number of students with a weight of at least 70 kg
e) the percentage of students with a weight less than 48 kg.
Problem 3 :
The data below is the scores (out of 100) for a Mathematics examination for 45 students.
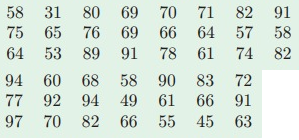
a) Construct a stem and leaf plot for this data using 3, 4, 5, 6, 7, 8 and 9 as the stems.
b) Redraw the stem and leaf plot so that it is ordered.
c) What advantages does a stem and leaf plot have over a frequency table?
d) What is the
i. highest
ii. lowest mark scored for the examination?
e) If an 'A' was awarded to students who scored 85 or more for the examination, what percentage of students scored an 'A' ?
f) Would you describe this distribution as:
i. symmetric ii. skewed iii. neither symmetric nor skewed?
Answer Key
1) a)
b)
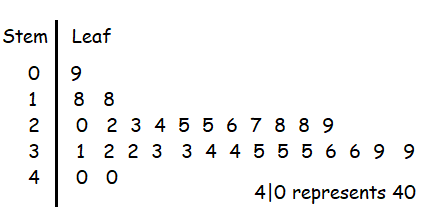
c) The stem and leaf plot displays all the actual data values.
d) Highest mark = 40, Lowest mark = 9
e) 20%
2) a) The minimum weight is 32 kg.
b) The maximum weight is 91 kg
c) The number of students with a weight greater than 52 kg is 20.
d) The number of students with a weight of at least 70 kg is 5.
e) The percentage of students with a weight less than 48 kg
= 20%
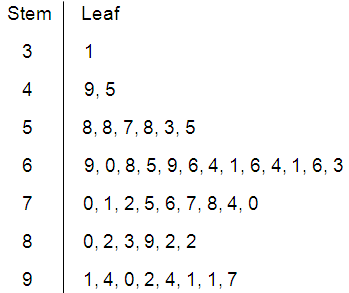
3) a)
b)
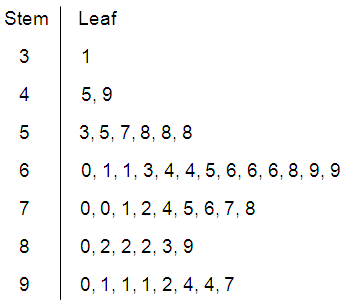
c)
The stem and leaf plot displays all the actual data values.
d)
Highest mark = 97.
Lowest mark = 31
e)
Score 85 or more = 9 students
= (9/45) × 100
= 20%
f) By observing the shape from the stem and leaf plot, it is not symmetric, it is positively skewed.
Problem 1 :
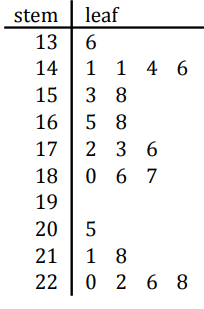
a) Determine the minimum value, maximum value and range of the data.
b) How many values are greater than 190?
c) How many values are less than 151?
Problem 2 :
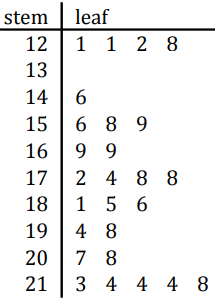
a) Determine the minimum value, maximum value and range of the data
b) How many values are greater than 163?
c) How many values are less than 177?
Problem 3 :
For the following sample of weights (in kg) of year 10 students, find
a) the minimum weight
b) the maximum weight
c) the percentage of students with a weight less than 48 kg.
Problem 4 :
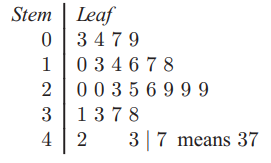
For the data set given, find
a) the minimum value b) the maximum value
c) the median d) The lower quartile
e) the upper quartile f) the range
g) the interquartile range.
Answer key
1) a) Minimum value = 136, Maximum value = 228, Range = 92
b) There are 7 values greater than 190.
c) 5 values are lesser than 151.
2) a) Minimum value = 121, Maximum value = 218
Range = 97
b) There are 18 values greater than 163.
c) 12 values are lesser than 177.
3) a) Minimum weight = 32
b) Maximum weight = 91
c) 20%
4) a) the minimum value = 3
b) the maximum value = 42
c) Median = 20
d) Lower quartile = 13
e) upper quartile = 29
f) the range = 39
g) the interquartile range = 16
Subscribe to our ▶️ YouTube channel 🔴 for the latest videos, updates, and tips.
Recent Articles
-
Finding Range of Values Inequality Problems
May 21, 24 08:51 PM
Finding Range of Values Inequality Problems -
Solving Two Step Inequality Word Problems
May 21, 24 08:51 AM
Solving Two Step Inequality Word Problems -
Exponential Function Context and Data Modeling
May 20, 24 10:45 PM
Exponential Function Context and Data Modeling