INTERPRETING CLUSTER AND OUTLIER FROM SCATTER PLOT WORKSHEET
Subscribe to our ▶️ YouTube channel 🔴 for the latest videos, updates, and tips.
Problem 1 :
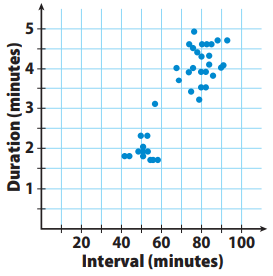
A scientist gathers information about the eruptions of Old Faithful, a geyser in Yellowstone National Park. She uses the data to create a scatter plot. The data show the length of time between eruptions (interval) and how long the eruption lasts (duration).

1) Describe any clusters you see in the scatter plot.
2) What do the clusters tell you about eruptions of Old Faithful?
3) Describe any outliers you see in the scatter plot.
4) Suppose the geyser erupts for 2.2 minutes after a 75-minute interval. Would this point lie in one of the clusters? Would it be an outlier? Explain your answer.
5) Suppose the geyser erupts after 80 minute interval. Give a range of possible duration times for which the point on the scatter plot would not be considered an outlier. Give your reasoning.
Problem 2 :
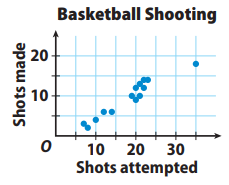
The scatter plot shows the basketball shooting results for 14 players. Describe any clusters you see in the scatter plot. Identify any outliers.

Problem 3 :

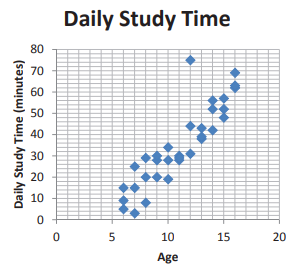
1) Does this scatter plot show a positive association, negative association or no association. Explain why ?
2) Is there an outlier in this data set, if so approximately how old is the outlier and about how many minutes does he or she study per day ?
3) Is this association linear or non linear ?
4) What can you say about this relationship between your age and amount that you study ?
Problem 4 :

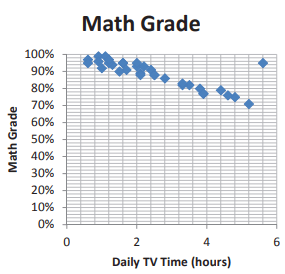
1) Does this scatter plot show a positive association, negative or no association ?
2) Is there an outlier in this data set, if so approximately how old is the outlier and about how many minutes does he or she study per day ?
3) Is this association linear or non linear ?
Subscribe to our ▶️ YouTube channel 🔴 for the latest videos, updates, and tips.
Recent Articles
-
Finding Range of Values Inequality Problems
May 21, 24 08:51 PM
Finding Range of Values Inequality Problems -
Solving Two Step Inequality Word Problems
May 21, 24 08:51 AM
Solving Two Step Inequality Word Problems -
Exponential Function Context and Data Modeling
May 20, 24 10:45 PM
Exponential Function Context and Data Modeling