INTERPRETATION OF DOT PLOT
Subscribe to our ▶️ YouTube channel 🔴 for the latest videos, updates, and tips.
Problem 1 :
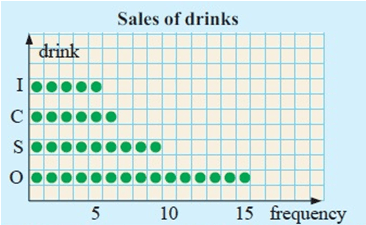
At recess time the sales of drinks were recorded over a three minute period.
O = 100 plus, S = soy milk, C = cola, I = iced tea.
The data was : OSSCI OCISO IOCSO OOOSC SOCOS SOOCO OIOIS
a) Draw a dot plot of the data
b) What is the mode?
Solution :
a) Dot plot of the data :
b) Mode :
In a data set most number of repeating terms is known as mode. Here O is appearing maximum number of times.
O = 100 plus
So, the mode is 100 plus.
Problem 2 :
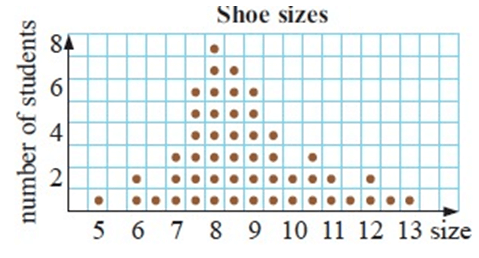
The dot plot shows shoe sizes for students in grade 6.
a) How many students are in grade 6 at this school?
b) How many have shoe size 9 or more?
c) what percentage have shoe sizes 8 or more?
Solution :
a) 50 students are in grade 6 at this school.
b) 22 shoe sizes
c) Total number of shoe sizes = 50
Shoe sizes 8 or more = 37
Percentage = (37/50) × 100
= 0.74 × 100
= 74%
Problem 3 :
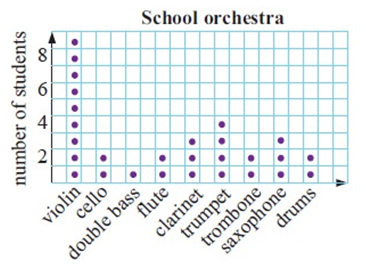
The dot plot shows the numbers of students playing various instruments in the school orchestra.
a) How many play stringed instruments?
b) How many students are in the orchestra?
c) Find the mode of the data.
Solution :
a) In the given, stringed instruments are Violin, Cello and Double bass :
Number of students who played Violin = 9
Number of students who played Cello = 2
Number of students who played Double bass = 1
= 9 + 2 + 1
= 12
So,12 played stringed instruments.
b) 28 students are in the orchestra.
c.) Mode :
The most frequent entry is Violin. So, mode of
the data is violin.
Problem 4 :
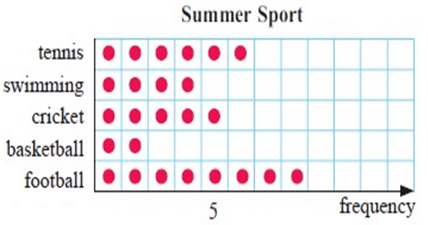
A class of students at a school in England were asked which summer sport they wanted to play. The choices were : T = tennis, S = swimming, C = cricket, B = basketball and F = football.
The data was : FFCTC CSFST TTBFS FFCSF TFTBC
a) Draw a horizontal dot plot of the data.
b) Find the mode of the data.
Solution :
a) Horizontal dot plot of the data.
b) Mode :
Football is entered the highest number of times.
So, mode of the data is football.
Problem 5 :
Students voted the most popular attractions at the local show to be the side shows (S), the farm animals (F), the ring events (R), the dogs and cats (D), and the wood chopping (W). The students in a class were then asked to name their favorite.
The data was : SRWSS WFDDS RRFWS RSRWS SRRRF
a) Draw a horizontal dot plot of the data.
b) Find the mode of the data.
Solution :
a) Vertical dot plot of the data.
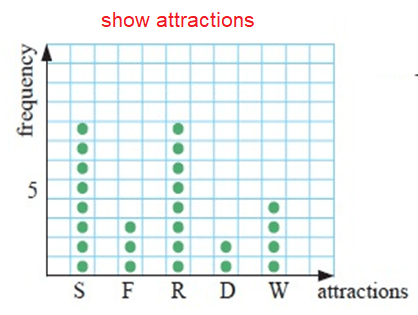
b) Mode :
Side shows and ring events are mode.
Problem 6 :
The dot plot shows the times of sixth grade students in a 100-meter race.

a. How many students ran in the race.
b. How can you collect these data? What are the units?
Solution :
a. Number of students ran in the race
= 1 + 2 + 1 + 1 + 1 + 2 + 3 + 5 + 4
= 20
b. In the race conducted in the school,
- 1 student took 13 minutes to cover the distance of 100 meters.
- 2 students took 13.2 minutes to cover the distance of 100 meters ...... etc
Problem 7 :
The dot plot shows the lengths of earthworms.

a. How many earthworms does it represent?
b. How can you collect these data? What are the units?
Solution :
a. Number of earthworms
= 2 + 1 + 2 + 2 + 1 + 1 + 2 + 3 + 1 + 2 + 1 + 1 + 2
= 21
b. In the lengths of earthworms,
- 2 earthworms has length of 15 mm.
- 1 earthworm has length of 16 mm.
Problem 8 :
Work with a partner. Identify the data set that is the least spread out and the data set that is the most spread out. Explain your reasoning.

Solution :
- The most spread is option c.
- The least spread is option d.
Problem 9 :
The dot plot shows the top speeds of 12 sports cars. Find and interpret the interquartile range of the data.

Order the speeds from slowest to fastest.
- Find the quartiles.
- Check for outliers in the data set.
Solution :
220, 230, 230, 240, 240, 245, 250, 250, 250, 260, 260, 270
It is arranged from least to greatest. Total number of data values = 12
Median = (6th value + 7th value)/2
= (245 + 250)/2
= 247.5
Median (Q2) = 247.5
|
220, 230, 230, 240, 240, 245 Q1 = (230 + 240)/2 = 235 |
250, 250, 250, 260, 260, 270 Q3 = (250 + 260)/2 = 255 |
Interquartile range (IQR) = Q3 - Q1
= 255 - 235
= 20
This means that the middle half of the speeds vary by no more than 20 miles per hour. You can use the quartiles and the interquartile range to check for outliers
|
Q1 - 1.5 (IQR) = 235 - 1.5(20) = 235 - 30 = 205 |
Q3 + 1.5 (IQR) = 255 + 1.5(20) = 255 + 30 = 285 |
There are no speeds less than 205 miles per hour or greater than 285 miles per hour. So, the data set has no outliers.
Subscribe to our ▶️ YouTube channel 🔴 for the latest videos, updates, and tips.
Recent Articles
-
Finding Range of Values Inequality Problems
May 21, 24 08:51 PM
Finding Range of Values Inequality Problems -
Solving Two Step Inequality Word Problems
May 21, 24 08:51 AM
Solving Two Step Inequality Word Problems -
Exponential Function Context and Data Modeling
May 20, 24 10:45 PM
Exponential Function Context and Data Modeling