UNDERSTAND BOX AND WHISKER PLOT
Subscribe to our ▶️ YouTube channel 🔴 for the latest videos, updates, and tips.
Problem 1 :

The box plot shown summarises the points scored by a basket ball team. Complete the statements about the results.
a) The highest score was ________ points.
b) The lowest score was ________ points.
c) Half of the scores were greater than or equal to _____ points.
d) The top 25% of the scores was ______ points.
e) The middle half of the scores were between _____ and ____ points.
f) Find the range of the data set.
g) Find the interquartile range of the data set.
Problem 2 :
The box & whisker graph below which shows the test results of a math class.

a) What was the high score on the test?
b) What percent of the class scored above a 72?
c) What was the median score on the test?
d) What percent of the class scored between 88 & 96?
e) Do you think that this test was too hard for the students? Explain.
Problem 3 :
The box & whisker graph below that shows how much time was spent per night on homework for sophomore class at a certain high school during September.

a) What percent of the sophomores spend more than 60 minutes on homework per night?
b) What is the range of times that the middle 50% of the sophomores spend on homework per night?
c) How many sophomores do not do homework?
d) What percent of the sophomores spend less than 20 minutes per night on homework?
Problem 3 :
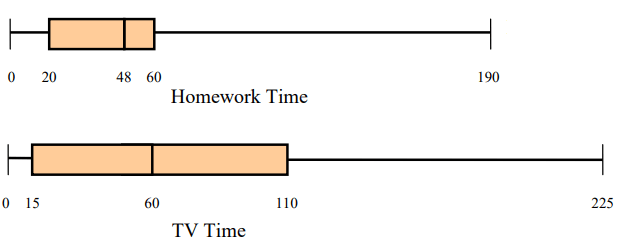
The box & whisker graphs below that compare homework time per night with TV time per night for the same group of sophomores

a) What percent of the sophomores watch TV for at least 15 minutes per night?
b) What is the 3rd quartile for the TV time data?
c) Is it more common for a sophomore at this high school to spend more than 1 hour on homework or more than 1 hour watching TV? Explain.
Problem 4 :
The accompanying box and whisker plot represents the scores earned on a math test.

1) What is the median score ?
a) 75 b) 70 c) 85 d) 77
2) What score represents the first quartile ?
a) 55 b) 70 c) 100 d) 75
3) What statement is not true about the box and whisker plot shown ?
a) 75 represents the mean score
b) 85 represents the 3rd quartile
c) 100 represents the maximum score
d) 55 represents the minimum score
4) A score of an 85 on the box and whisker plot shown refers to :
a) the third quartile b) the maximum score c) the median d) the mean
Subscribe to our ▶️ YouTube channel 🔴 for the latest videos, updates, and tips.
Recent Articles
-
Finding Range of Values Inequality Problems
May 21, 24 08:51 PM
Finding Range of Values Inequality Problems -
Solving Two Step Inequality Word Problems
May 21, 24 08:51 AM
Solving Two Step Inequality Word Problems -
Exponential Function Context and Data Modeling
May 20, 24 10:45 PM
Exponential Function Context and Data Modeling