IDENTIFY PROPORTIONAL RELATIOSHIPS FROM GRAPHS
Subscribe to our ▶️ YouTube channel 🔴 for the latest videos, updates, and tips.
Problem 1 :
The graph below represents the total number of plants and number of seed packets used
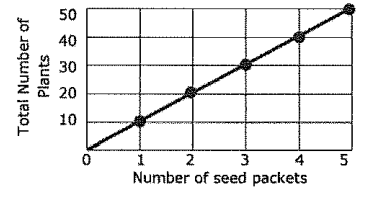
a) What is the constant of proportionality ?
b) What does the point (2, 20) represent ?
Solution :
a) Taking one of the points from the graph, say (1, 10).
Constant of proportionality (k) = y/x
k = 10/1
k = 10
So, the constant of proportionality is 10.
b) For every 2 packets of seeds, there are total of 20 plants.
Problem 2 :
The graph below represents the total number of cups of coffee and the total amount of sugar required to make the coffee.
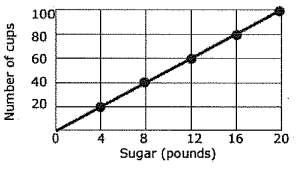
a) What is the constant of proportionality ?
b) What does the point (12, 60) represent ?
Solution :
a) Taking one of the points from the graph, say (4, 20).
Constant of proportionality (k) = y/x
k = 20/4
k = 5
So, the constant of proportionality is 5.
b) In 12 pounds of sugar, we can make 60 cups of coffee.
Problem 3 :
The graph below represents the chocolate consumed by people.
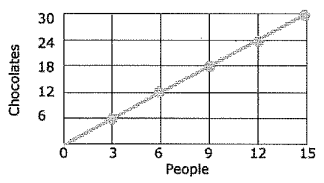
a) What is the constant of proportionality ?
b) What does the point (9, 18) represent ?
Solution :
a) Taking one of the points from the graph, say (3, 6).
Constant of proportionality (k) = y/x
k = 6/3
k = 2
So, the constant of proportionality is 2.
b) 9 people are consuming 18 chocolates.
Problem 4 :
The graph below represents the number of songs played on a radio station.
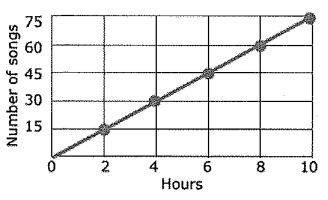
a) What is the constant of proportionality ?
b) What does the point (8, 60) represent ?
Solution :
a) Taking one of the points from the graph, say (4, 30).
Constant of proportionality (k) = y/x
k = 30/4
k = 15/2
So, the constant of proportionality is 7.5.
b) In 8 minutes, 60 songs are played in the radio station.
Problem 5 :
The graph below represents the number of pieces of paper that are found in boxes.
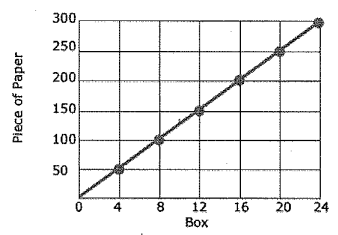
a) What is the constant of proportionality ?
b) What does the point (8, 100) represent ?
Solution :
a) Taking one of the points from the graph, say (4, 50).
Constant of proportionality (k) = y/x
k = 50/4
k = 25/2
So, the constant of proportionality is 12.5
b) In 8 boxes, there are 100 piece of papers.
Problem 6 :
The graph below represents the number of containers and liters of water contained in containers.
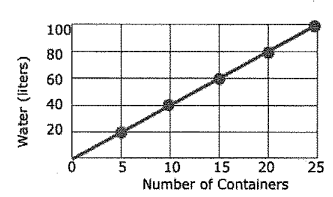
a) What is the constant of proportionality ?
b) What does the point (25, 100) represent ?
Solution :
a) Taking one of the points from the graph, say (5, 20).
Constant of proportionality (k) = y/x
k = 20/5
k = 4
So, the constant of proportionality is 4.
b) 100 liters of water is there is 25 containers.
Problem 7 :
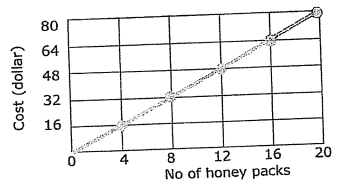
The graph below represents the cost of packs of honey as a unit rate $4 per pack of honey. The unit rate is represented as $4/ pack. Represent the relationship using a table and an equation.
Solution :
|
No of honey packs 0 4 8 12 16 20 |
Cost (dollars) 0 16 32 48 64 80 |
Constant of proportionality (k) = y/x
k = 16/4
k = 4
Since the given is proportional relationship, the required equation will be in the form of y = kx.
Equation represented by the graph y = 4x
Problem 8 :
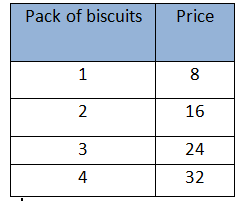
Andrew brought a packs of biscuits. Create the graph to determine if the number of packs and price are proportional for each serving size listed in the table. If the quantities are proportional, what is the constant of proportionality or unit rate that defines the relationship.
Solution :
The given data represents the proportional relationship.
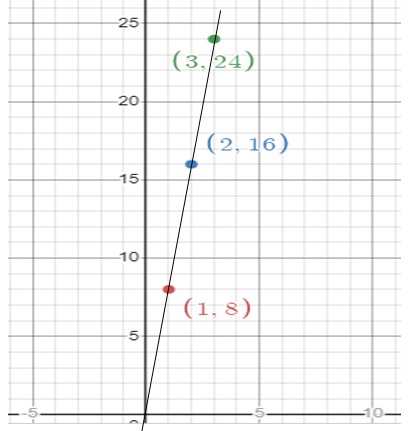
Constant of proportionality (k) = y/x
k = 8/1
k = 8
Unit rate = $8
Equation represented by the table y = 8x.
Subscribe to our ▶️ YouTube channel 🔴 for the latest videos, updates, and tips.
Recent Articles
-
Finding Range of Values Inequality Problems
May 21, 24 08:51 PM
Finding Range of Values Inequality Problems -
Solving Two Step Inequality Word Problems
May 21, 24 08:51 AM
Solving Two Step Inequality Word Problems -
Exponential Function Context and Data Modeling
May 20, 24 10:45 PM
Exponential Function Context and Data Modeling