HOW TO GRAPH LINEAR INEQUALITIES IN TWO VARIABLES
Subscribe to our ▶️ YouTube channel 🔴 for the latest videos, updates, and tips.
To graph inequalities in two variables, we will follow the instruction given below.
Step 1 :
Consider the given inequalities as equations. By finding x and y intercepts, we will get two points on the x and y axis respectively.
Step 2 :
To find x intercept, we put y = 0
To find y intercept, put x = 0
Step 3 :
If we have lesser than or equal to sign ≤, greater than or equal to sign ≥, we have to use solid line to draw the graph.
If we have lesser than sign <, greater than >, we have to use the dotted line to draw the graph.
Step 4 :
Take one point above or below the line and put in the given inequality.
If the given inequality satisfies the point, we can shade that particular region. Other wise shade the opposite region.
Graph the solutions to each of the following inequalities on a separate set of axes.
Problem 1 :
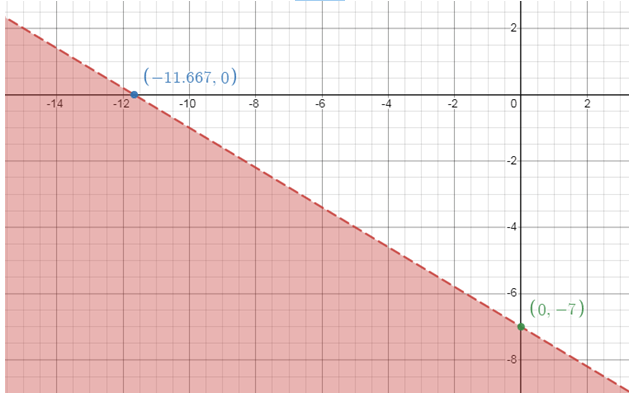
y < -3/5x - 7
Solution :
y = -3/5x - 7
x -intercept : y = 0
-3/5x - 7 = 0
-3/5x = 7
x = -35/3
x -intercept: (-35/3, 0)
y -intercept : x = 0
y = -3/5(0) - 7
y = -7
y -intercept: (0, -7)
Check :
|
Point (-15, -8) -8 < -3/5(-15) - 7 -8 < 9 - 7 -8 < 2 True |
Point (-15, -10) -10 < -3/5(-15) - 7 -10 < 9 - 7 -10 < 2 True |
Problem 2 :
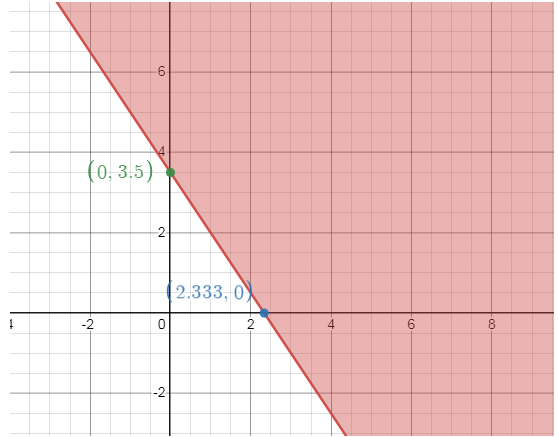
3x + 2y ≥ 7
Solution :
3x + 2y = 7
2y = -3x + 7
y = -3/2x + 7/2
x -intercept : y = 0
-3/2x + 7/2 = 0
3/2x = 7/2
x = 7/3
x -intercept: (7/3, 0)
y -intercept : x = 0
y = -3/2x + 7/2
y = -3/2(0) + 7/2
y = 7/2
y -intercept: (0, 7/2)
Check :
|
Point (3, 4) 3(3) + 2(4) ≥ 7 9 + 8 ≥ 7 17 ≥ 7 True |
Point (6, 5) 3(6) + 2(5) ≥ 7 18 + 10 ≥ 7 28 ≥ 7 True |
Problem 3 :
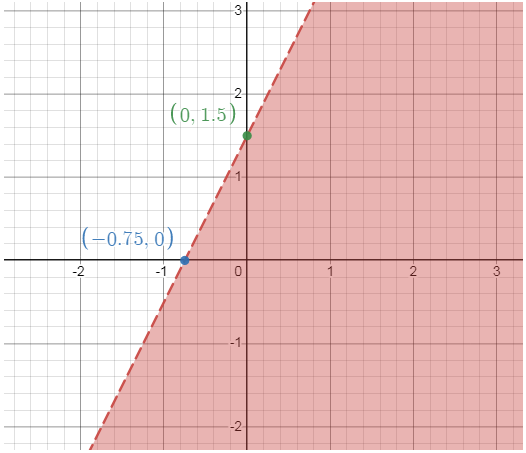
-4x + 2y < 3
Solution :
-4x + 2y = 3
2y = 4x + 3
y = 2x + 3/2
x -intercept : y = 0
2x + 3/2 = 0
2x = -3/2
x = -3/4
x -intercept: (-3/4, 0)
y -intercept : x = 0
y = 2x + 3/2
y = 2(0) + 3/2
y = 3/2
y -intercept: (0, 3/2)
Check :
|
Point (3, 4) 3(3) + 2(4) ≥ 7 9 + 8 ≥ 7 17 ≥ 7 True |
Point (6, 5) 3(6) + 2(5) ≥ 7 18 + 10 ≥ 7 28 ≥ 7 True |
Problem 4 :
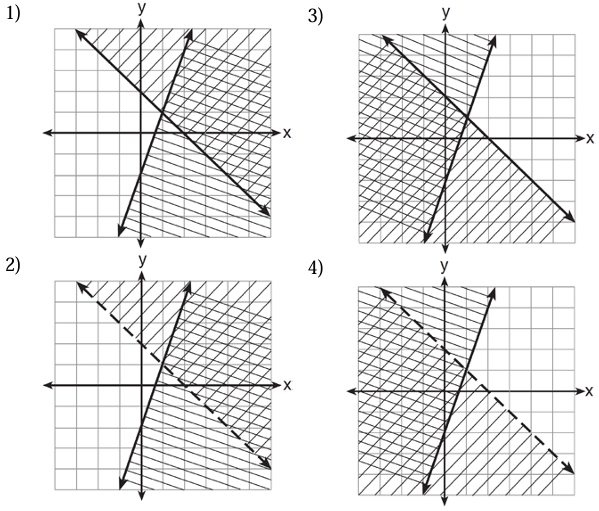
Given x + y > 2
y ≤ 3x - 2
Which graph shows the solutions of the given set of inequalities ?
Solution :
x + y > 2
y ≤ 3x - 2
|
x + y = 2 x-intercept : Put y = 0 x = 2 y-intercept : Put x = 0 y = 2 (2, 0) and (0, 2) |
y = 3x - 2 x-intercept : Put y = 0 3x - 2 = 0 3x = 2 x = 2/3 y-intercept : Put x = 0 y = -2 (2/3, 0) and (0, -2) |
x + y = 2
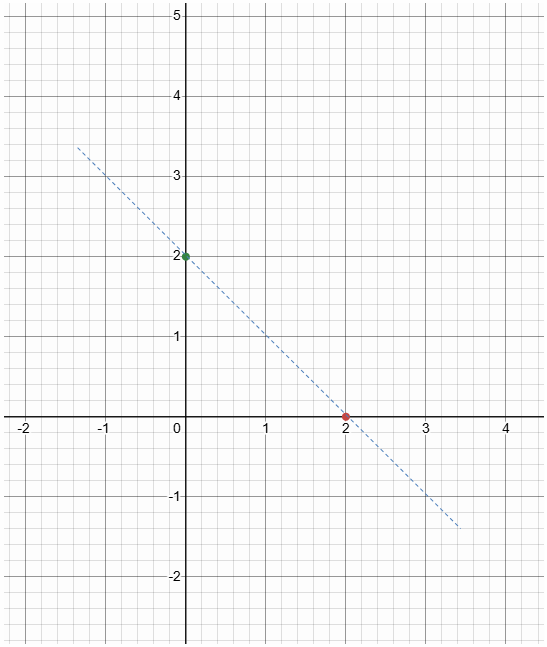
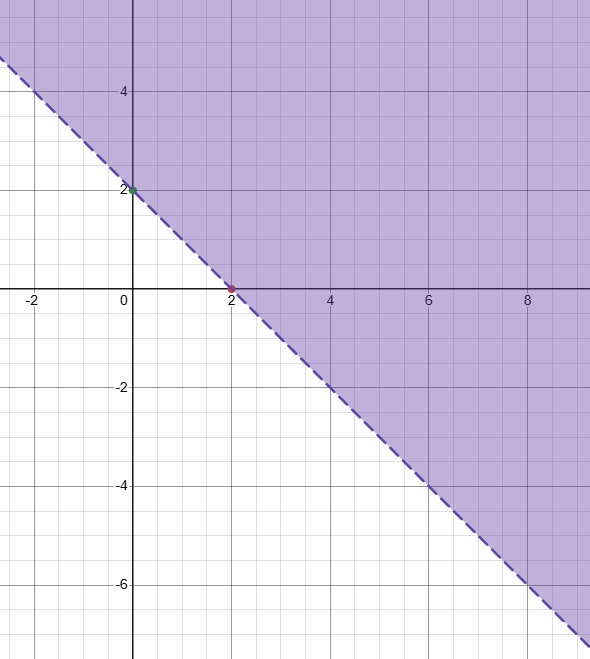
Choosing one of the points above the line (2, 2),
x + y > 2
applying it, 2 + 2 > 2 ==> 4 > 2 (true)
So, we may shade the region above the line.
y = 3x - 2
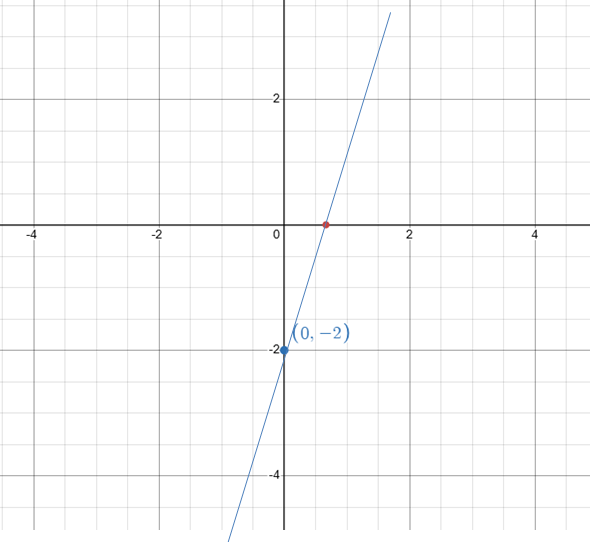
Choosing one of the points below the line (2, -2),
y ≤ 3x - 2
-2 ≤ 3(-2) - 2
-2 ≤ -8 (true)
So, we may shade the region above the line.
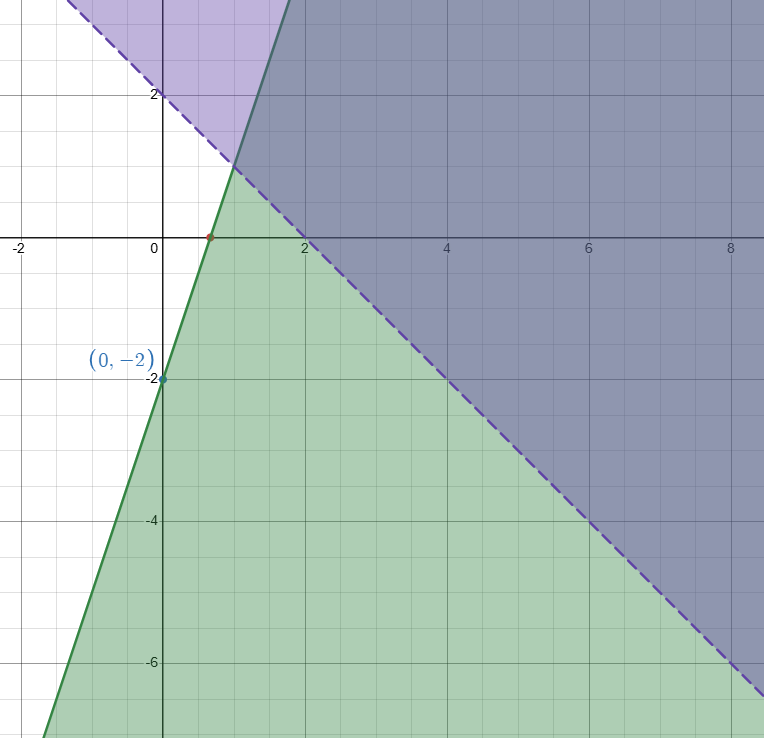
So, option 2 is correct.
Problem 5 :
An online store sells digital cameras and cell phones. The store makes a $100 profit on the sale of each digital camera x and a $50 profit on the sale of each cell phone y. The store wants to make a profit of at least $300 from its sales of digital cameras and cell phones. Write and graph an inequality that represents how many digital cameras and cell phones they must sell. Identify and interpret two solutions of the inequality.
Solution :
100x + 50y ≥ 300
50y ≥ -100x + 300
Dividing by 50 on both sides, we get
y ≥ (-100x/50) + (300/50)
y ≥ -2x + 6
Let y = -2x + 6
x - intercept :
Put y = 0
-2x + 6 = 0
-2x = -6
x = 3
(3, 0)
y - intercept :
Put x = 0
y = -2(0) + 6
y = 6
(0, 6)
It must be a solid line.
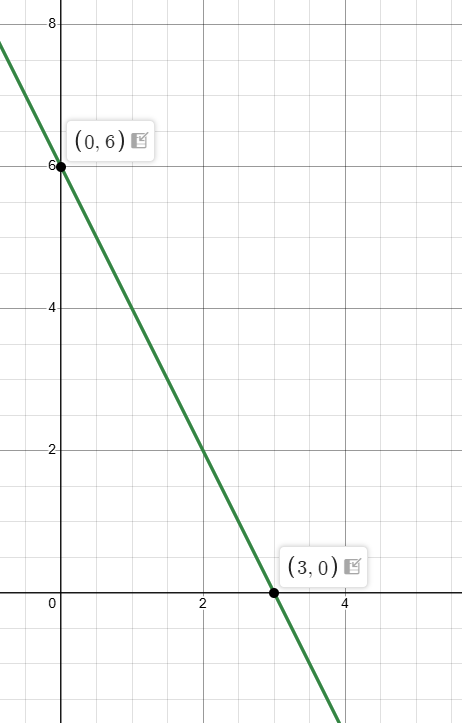
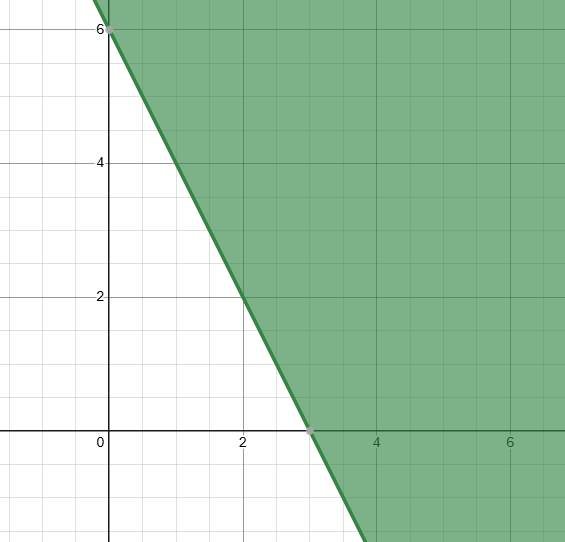
Choosing one of the point above the line, we get (2, 6).
6 ≥ -2(2) + 6
6 ≥ -4 + 6
6 ≥ 2
True
Since it is true, we shade the region above the line.
Problem 6 :
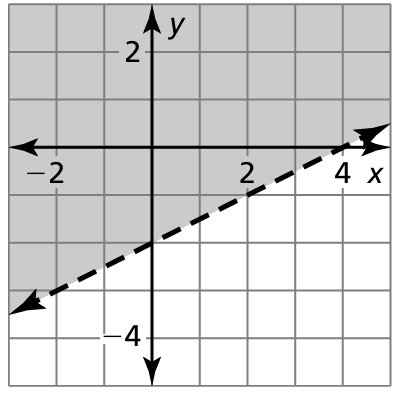
Write an inequality that represents the graph.
Solution :
Since it is dotted line, we may use the less than sign or greater than sign.
Choosing two points which lies on the line (2, -1) and (0, -2)
Slope = (-2 + 1) / (0 - 2)
= -1/(-2)
= 1/2
Equation of the line will be in the form y = mx + b
y = (1/2) x + (-2)
Let us fix the less than sign and choose the point from the solution region.
y < (1/2) x - 2
Choosing the point (2, 2) from the solution region, we get
2 < (1/2) (2) - 2
2 < 1 - 2
2 < -1
False
Choosing the greater than sign,
y > (1/2) x - 2
Applying the point (2, 2), we get
2 > (1/2) (2) - 2
2 > 1 - 2
2 > -1
True
So, the inequality represented by the graph is y > (1/2) x - 2.
Subscribe to our ▶️ YouTube channel 🔴 for the latest videos, updates, and tips.
Recent Articles


-
Finding Range of Values Inequality Problems
May 21, 24 08:51 PM
Finding Range of Values Inequality Problems -
Solving Two Step Inequality Word Problems
May 21, 24 08:51 AM
Solving Two Step Inequality Word Problems -
Exponential Function Context and Data Modeling
May 20, 24 10:45 PM
Exponential Function Context and Data Modeling