GRAPHING SYSTEMS OF INEQUALITIES
Subscribe to our ▶️ YouTube channel 🔴 for the latest videos, updates, and tips.
To obtain the common region for both given linear inequalities, we have to follow the steps given below.
Step 1 :
First, we have to assume the given inequalities as equations.
Then, we have to draw the graph of the line using x and y-intercepts.
Step 2 :
The region which satisfies the inequality can be shaded.
To check if the inequality is being satisfied by applying any point from the region, the point which satisfies the inequality is known as the solution region and that can be shaded.
Step 3 :
Do the process explained in step 2 for the second inequality.
Step 4 :
The overlapping region is the solution region for the system of inequalities given.
Sketch the graph of the system of linear inequalities.
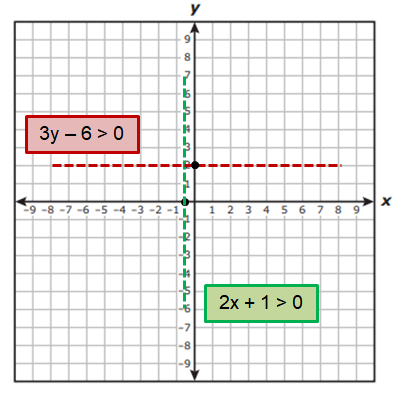
Example 1 :
2x + 1 > 0
3y - 6 > 0
Solution :
Given,
2x + 1 > 0 and 3y - 6 > 0
Converting the inequalities into equations.
2x + 1 = 0 and 3y - 6 = 0
|
2x + 1 = 0 2x = -1 x = -1/2 |
3y - 6 = 0 3y = 6 y = 2 |
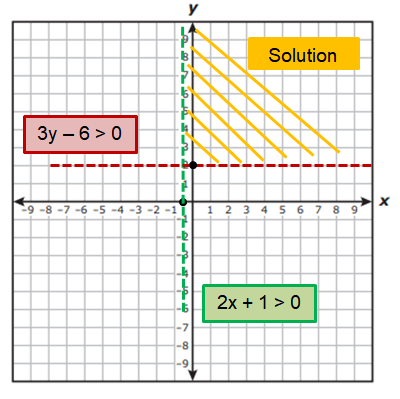
By plotting the x and y values on the graph, we get
If x = 0, then 2(0) + 1 > 0 (True)
So, we can shade the region which is right to 2x + 1 > 0
If y = 3, then 3(3) - 6 > 0 (True)
So, we can shade the region which is above to 3y - 6 > 0
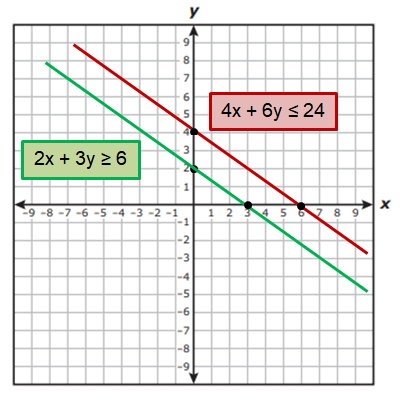
Example 2 :
2x + 3y ≥ 6
4x + 6y ≤ 24
Solution :
Given,
2x + 3y ≥ 6 and 4x + 6y ≤ 24
Converting the inequalities into equations.
2x + 3y = 6 and 4x + 6y = 24
To graph the line 2x + 3y = 6, we find x and y intercepts.
|
x-intercept : Put y = 0 2x + 3(0) = 6 2x = 6 x = 3 |
y-intercept : Put x = 0 2(0) + 3y = 6 3y = 6 y = 2 |
To graph the line 4x + 6y = 24, we find x and y intercepts.
|
x-intercept : Put y = 0 4x + 6(0) = 24 4x = 24 x = 6 |
y-intercept : Put x = 0 4(0) + 6y = 24 6y = 24 y = 4 |
The point on the line 2x + 3y = 6 are (3, 0) and (0, 2)
The point on the line 4x + 6y = 24 are (6, 0) and (0, 4)
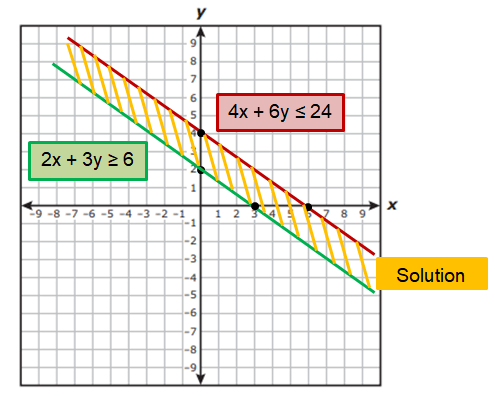
By plotting the points on the graph, we get
If x = 4 and y = 3, then 2(4) + 3(3) ≥ 6 (True)
So, we can shade the region which is above to 2x + 3y ≥ 6.
If x = 2 and y = 2, then 4(2) + 6(2) ≤ 24 (True)
So, we can shade the region which is below to 4x + 6y ≤ 24.
Example 3 :
2y - x ≥ -6
2y - 3x < -6
Solution :
Given,
2y - x ≥ -6 and 2y - 3x < -6
Converting the inequalities into equations.
2y - x = -6 and 2y - 3x = -6
To graph the line 2y - x = -6, we find x and y intercepts.
|
x-intercept : Put y = 0 2y - x = -6 2(0) - x = -6 - x = -6 x = 6 |
y-intercept : Put x = 0 2y - x = -6 2y - 0 = -6 2y = -6 y = -3 |
To graph the line 2y - 3x = -6, we find x and y intercepts.
|
x-intercept : Put y = 0 2y - 3x = -6 2(0) - 3x = -6 - 3x = -6 x = 2 |
y-intercept : Put x = 0 2y - 3x = -6 2y - 3(0) = -6 2y = -6 y = -3 |
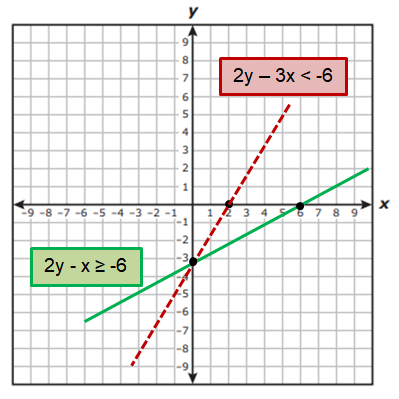
The point on the line 2y - x = -6 are (6, 0) and (0, -3)
The point on the line 2y - 3x = -6 are (2, 0) and (0, -3)
By plotting the points on the graph, we get
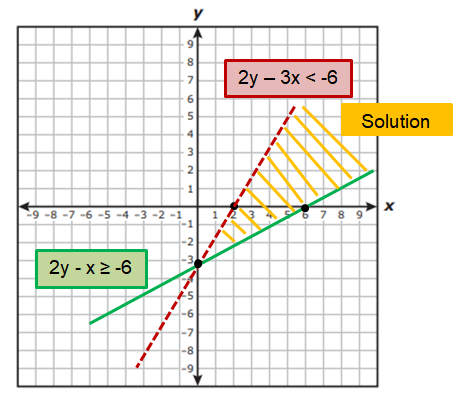
If x = 3 and y = 0, then 2(0) - 3 ≥ -6 (True)
So, we can shade the region which is above to 2y - x ≥ -6.
If x = 3 and y = -5, then 2(-5) - 3(3) < -6 (True)
So, we can shade the region which is below to 2y - 3x < -6
Example 4 :
Write a system of linear inequalities represented by the graph.

Solution :
Inequality represented by the solid line :
The solid line passes through the point (-3, 0). It's shaded region is toward the right of the line. Then x ≥ -3
Inequality represented by the falling line :
Two of the points joining the line are (0, 1) and (2, 0)
y-intercept = 2
Slope = (0 - 1) / (2 - 0)
= 1/2
y = mx + b
y = (1/2)x + 1
The shaded region is below the line, then the inequality sign suits for the situation is <.
y < (1/2)x + 1
Inequality represented by the raising line :
Two of the points joining the line are (-4, -4) and (0, -2)
y-intercept = -2
Slope = (-2 + 4) / (0 + 4)
= 2/4
= 1/2
y = mx + b
y = (1/2)x - 2
The shaded region is below the line, then the inequality sign suits for the situation is >.
y > (1/2)x + 1
So, the inequalities represented by the shaded region are
x ≥ -3
y < (1/2)x + 1
y > (1/2)x + 1
Example 5 :
You are buying movie passes and gift cards as prizes for an event. You need at least five movie passes and two gift cards. A movie pass costs $6 and a gift card costs $10. The most you can spend is $70.
a. Write and graph a system of linear inequalities that represents the situation.
b. Identify and interpret two possible solutions.
Solution :
a) Let x be the number of passes for movie and y be the number of gift cards.
x ≥ 5 and y ≥ 2
6x + 10y ≤ 70

b) Possible solutuons are (5, 2) and (6, 3)
6x + 10y ≤ 70
When number of movie tickets = 5, number of gift cards = 2
6(5) + 10(2) ≤ 70
30 + 20 ≤ 70
50 ≤ 70
When number of movie tickets = 6, number of gift cards = 3
6(6) + 10(3) ≤ 70
36 + 30 ≤ 70
66 ≤ 70
Subscribe to our ▶️ YouTube channel 🔴 for the latest videos, updates, and tips.
Recent Articles
-
Finding Range of Values Inequality Problems
May 21, 24 08:51 PM
Finding Range of Values Inequality Problems -
Solving Two Step Inequality Word Problems
May 21, 24 08:51 AM
Solving Two Step Inequality Word Problems -
Exponential Function Context and Data Modeling
May 20, 24 10:45 PM
Exponential Function Context and Data Modeling