GRAPH FROM SLOPE INTERCEPT EQUATION
Subscribe to our ▶️ YouTube channel 🔴 for the latest videos, updates, and tips.
To draw the graph of the line from slope intercept equation, we have to know about slope and y-intercept.
Slope :
Slope (m) = Change in y / change in x
From origin, to measure the change in y we are allowed to move up or down.
From origin, to measure the change in x we are allowed to move right or left.
|
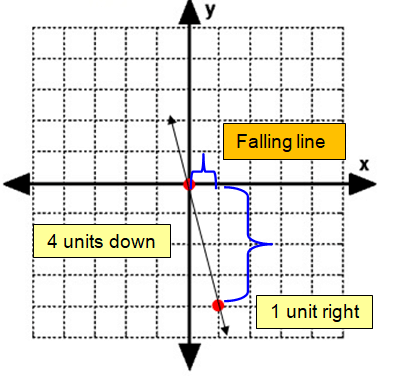
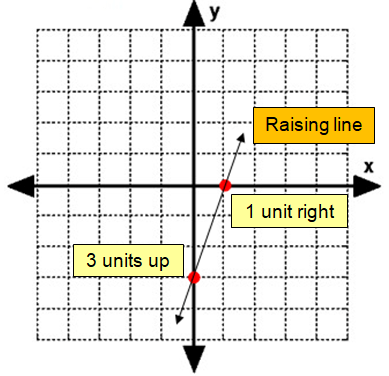
Sign of slope Positive Negative Zero Undefined |
Types of line Raising line Falling line Horizontal line Vertical line |
y-intercept :
The line where it crosses the y-axis is known as y-intercept.
Graph the following equations of lines :
(Hint : Determine the slope and y – intercept)
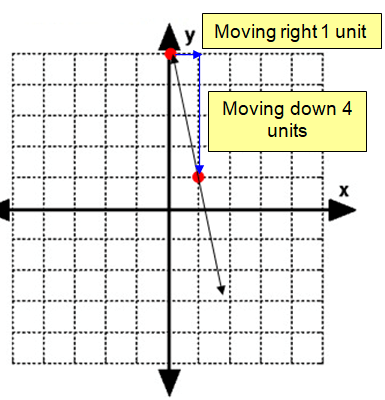
Problem 1 :
y = -4x + 5
Solution :
y = -4x + 5
By comparing the given equation with slope intercept form, we get
y = mx + b
m = -4
So, slope is -4 and y– intercept is 5.
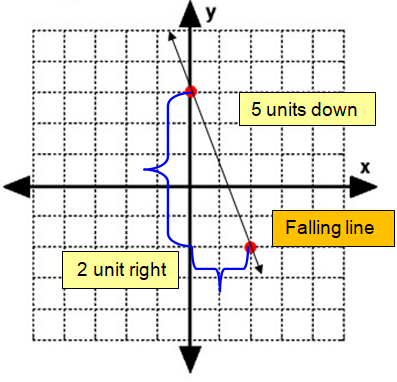
Problem 2 :
y = (3/4)x - 1
Solution :
y = (3/4)x - 1
y = mx + b
m = 3/4
So, the slope is 3/4 and y – intercept = -1.
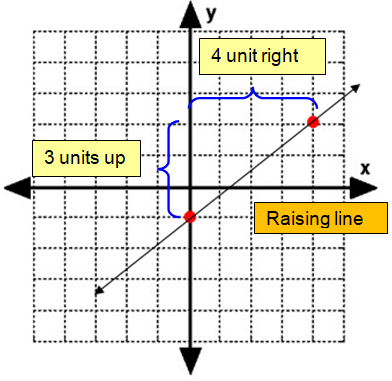
Problem 3 :
y = 2x - 2
Solution :
y = 2x - 2
y = mx + b
m = 2
So, the slope is 2 and y – intercept is -2.
Problem 4 :
y = (-5/2)x + 3
Solution :
y = (-5/2)x + 3
m = -5/2
So, the slope is -5/2 and y – intercept is 3.
Problem 5 :
y = -4x
Solution :
y = -4x
y = mx + b
m = -4
So, the slope is -4 and y – intercept is 0.
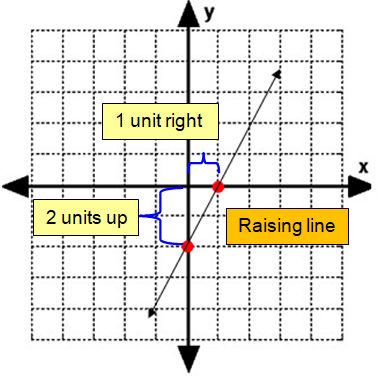
Problem 6 :
y = 3x – 3
Solution :
y = 3x – 3
m = 3
So, the slope is 3 and y – intercept is -3.
Problem 7 :
Match the system of linear equations with the corresponding graph. Use the graph to estimate the solution. Check your solution
|
Problem 1 y = 2.5x + 1 y = x |
Problem 2 y = 2x - 3 y = (-1/2)x + 1 |
Problem 3 y = (1/4)x - 2 y = (-2/5)x + 4 |

Solution :
Problem 1 :
y = 2.5x + 1 ------(1)
y = x ------(2)
Comparing the given equations with y = mx + b
Slope (m1) = 2.5 and y-intercept (b1) = 1
Slope (m2) = 1 and y-intercept (b2) = 0
Both should be raising line.
Problem 2 :
y = 2x - 3 ------(1)
y = (-1/2)x + 1 ------(2)
Comparing the given equations with y = mx + b
Slope (m1) = 2 and y-intercept (b1) = -3
Slope (m2) = -1/2 and y-intercept (b2) = 1
The first one should be raising line and the second line should be falling line.
Problem 3 :
y = (1/4)x - 2 ------(1)
y = (-2/5)x + 4 ------(2)
Slope (m1) = 1/4 and y-intercept (b1) = -2
Slope (m2) = -2/5 and y-intercept (b2) = 4
The first one should be raising line and the second line should be falling line.
Option A :
y-intercept of falling line = 4
y-intercept of raising line = -3
Matches with problem 2.
Option B :
y-intercept of falling line = 1
y-intercept of raising line = 0
Matches with Problem 1
Option C :
y-intercept of falling line = 4
y-intercept of raising line = -2
Matches with problem 3
Problem 8 :
Solve the equations algebraically and graphically.
(1/2)x - 2 = (-1/4)x + 1

Solution :
Solving the equation algebraically :
(1/2)x - 2 = (-1/4)x + 1
(1/2) x + (1/4)x = 1 + 2
(2x + x)/4 = 3
3x/4 = 3
x = 3(4/3)
x = 4
Applying the value in y = (1/2)x - 2
y = (1/2)(4) - 2
y = 2 - 2
y = 0
So, the point of intersection is (4, 0). By observing the graph, we get the points of intersection is (4, 0).
Problem 9 :
Solve the equations algebraically and graphically.
(2/3)x + 4 = (1/6)x + 5/2

Solution :
Solving the equation algebraically :
(2/3)x + 4 = (1/6)x + 5/2
(2/3) x - (1/6)x = (5/2) - 4
(4x - x)/6 = (5 - 8)/2
3x/6 = -3/2
x/2 = -3/2
x = -3
Applying the value in y = (2/3)x + 4
y = (2/3)(3) + 4
y = 2 + 4
y = 6
So, the point of intersection is (-3, 6). By observing the graph, we get the points of intersection is (-3, 6).
Problem 10 :
You have 4x + 10 CDs and your friend has 5x + 22 CDs. Is it possible that you both have the same number of CDs? Explain your reasoning.
Solution :
4x + 10 = 5x + 22
4x - 5x = 22 -10
-x = 12
x = -12
Number of CDs cannot be negative. So, the situation is not possible.
Subscribe to our ▶️ YouTube channel 🔴 for the latest videos, updates, and tips.
Recent Articles
-
Finding Range of Values Inequality Problems
May 21, 24 08:51 PM
Finding Range of Values Inequality Problems -
Solving Two Step Inequality Word Problems
May 21, 24 08:51 AM
Solving Two Step Inequality Word Problems -
Exponential Function Context and Data Modeling
May 20, 24 10:45 PM
Exponential Function Context and Data Modeling