FIND THE MEAN MEDIAN AND MODE FROM A STEM AND LEAF PLOT
Subscribe to our ▶️ YouTube channel 🔴 for the latest videos, updates, and tips.
Problem 1 :
Find the data displayed in stem and leaf plot, find the
(i) Mean (ii) Median and (iii) Mode
Solution :
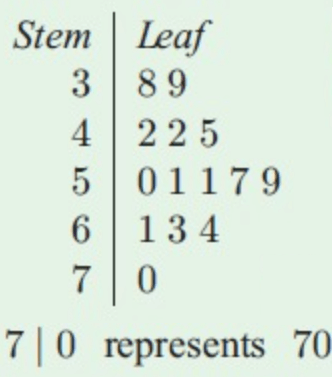
The data values from the stem and leaf.
38, 39, 42, 42, 45, 50, 51, 51, 57, 59, 61, 63, 64, 70
Total number of data values = 14
i) Mean :
Mean = Sum of the value / Total number of values
= (38+39+42+42+45+50+51+51+57+59+61+63+64+70)/14
= 732/14
= 52.28
ii) Median :
Number of quantities = 14
Median = [(14/2)th value + ((14/2) + 1)th value]/2
= (7th value + 8th value)/2
= (51 + 51)/2
= 51
iii) Mode :
42 and 51 are modes.
Problem 2 :
Find the data displayed in stem and leaf plot, find the
(i) Mean (ii) Median and (iii) Mode
Solution :
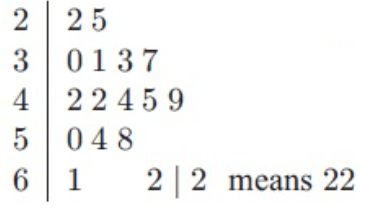
22, 25, 30, 31, 33, 37, 42, 42, 44, 45, 49, 50, 54, 58, 61
i) Mean :
(22+25+30+31+33+37+42+42+44+45+49+50+54+58+61)/15
= 623/15
= 41.53
ii) Median :
= (15 + 1)/2 th value
= 16/2 th value
= 8 th value
= 42
iii) Mode :
Most repeated term is 42
So, mode is 42.
Problem 3 :
Find the data displayed in stem and leaf plot, find the
(i) Mean (ii) Median and (iii) Mode
Solution :
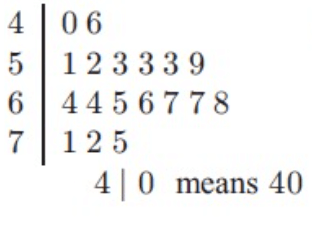
40, 46, 51, 52, 53, 53, 53, 59, 64, 64, 65, 66, 67, 67, 68, 71, 72, 75
i) Mean :
(40+46+51+52+53+53+53+59+64+64+65+66+67+67+68+71+72+75)/18
= 1086/18
= 60.33
ii) Median :
= (9th value + 10th value)/2
= (64 + 64)/2
= 64
iii) Mode :
Most repeated term is 53
So, mode is 53.
Problem 4 :
Find the data displayed in stem and leaf plot, find the
(i) Mean (ii) Median and (iii) Mode
Solution :
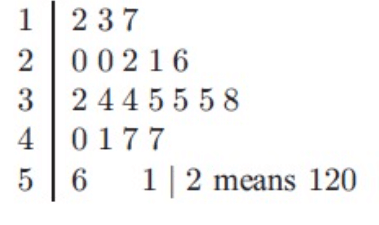
120, 130, 170, 200, 200, 220, 210, 260, 320, 340, 340, 350, 350, 350, 380, 400, 410, 470, 470, 560
i) Mean :
Sum of numbers =
(120+130+170+200+200+220+210+260+320+340+340+350+350+350+380+400+410+470+470+560)
= 6250/20
= 312.5
ii) Median :
= (10th value + 11th value)/2
= (340 + 340)/2
= 340
iii) Mode :
Most repeated term is 350
So, mode is 350.
Problem 5 :
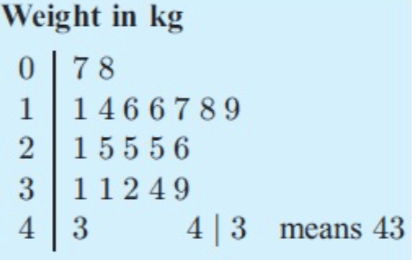
The weight of the fish caught on a one day fishing trip are displayed in a stem and leaf plot shown. Find the median weight
Solution :
Crossing out pairs from top and from bottom, the remaining quantities are 21 and 25
Average of 21 and 25 :
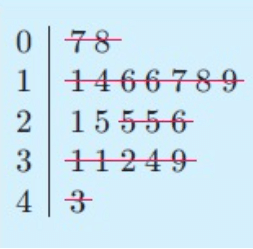 |
= (21 + 25)/2 = 46/2 = 23 |
So, median weight is 23 kg.
Problem 6 :
The stem-and-leaf plot shows student test scores.
(a) How many students scored less than 80 points?
(b) How many students scored at least 90 points?
(c) How are the data distributed?

Solution :
a. There are five scores less than 80 points: 66, 70, 75, 77, and 78. Five students scored less than 80 points.
b. There are four scores of at least 90 points: 90, 92, 99, and 100. Four students scored at least 90 points.
c. There are few low test scores and few high test scores. So, most of the scores are in the middle.
Problem 7 :
Which statement is not true?
a) Most of the plants are less than 20 inches tall.
b) The median plant height is 11 inches.
c) The range of the plant heights is 35 inches.
d) The plant height that occurs most often is 11 inches.

Solution :
There are 15 plant heights. So, the median is the eighth data value, 10 inches. The correct answer is option b.
Problem 8 :
Use the stem-and-leaf plot below.

a) How many data values are in the set?
b) What is the least value? greatest value?
c) What is the median? range?
d) Is the value 32 in the set? Explain
Solution :
a) Number of data values = 11
b) Least value = 4, greatest value = 42
c) Arranging the values from least to greatest,
4, 6, 8, 10, 23, 24, 30, 36, 36, 39, 42
Median = (11 + 1)/2 th value
= 12/2 th value
= 6th value
= 24 is the median
Range = greatest value - smallest value
= 42 - 4
= 38
d) No, 32 is not one of the value.
Problem 9 :
The stem-and-leaf plot shows the number of digs for the top 15 volleyball players at a recent women’s AVP Miami Open.

a) How many players had more than 60 digs?
b) Find the mean, median, mode, and range of the data.
c) Describe the distribution of the data.
d) Which data value is the outlier? Describe how the outlier affects the mean.
Solution :
a) More than 60 digs are
62, 63, 63, 67, 75, 97
Number of players had more than 60 digs = 6
b) Mean
= (41 + 41 + 43 + 43 + 45 + 50 + 52 + 53 + 54 + 62 + 63 + 63 + 67 + 75 + 97)/15
= 849/15
= 56.6
Approximately 57
Median :
Arranging the data from least to greatest,
41, 41, 43, 43, 45, 50, 52, 53, 54, 62, 63, 63, 67, 75, 97
Number of values = 15
Median = (15 + 1)/2 th value
= 16/2th value
= 8th value
= 53 is the median
Mode are 41, 43, 63.
Range = 97 - 41
= 56
c) Positively skewed.
d) 97 is the outlier.
Subscribe to our ▶️ YouTube channel 🔴 for the latest videos, updates, and tips.
Recent Articles
-
Finding Range of Values Inequality Problems
May 21, 24 08:51 PM
Finding Range of Values Inequality Problems -
Solving Two Step Inequality Word Problems
May 21, 24 08:51 AM
Solving Two Step Inequality Word Problems -
Exponential Function Context and Data Modeling
May 20, 24 10:45 PM
Exponential Function Context and Data Modeling