FIND DOMAIN AND RANGE OF RELATION AND CHECK IF IT IS FUNCTION
Subscribe to our ▶️ YouTube channel 🔴 for the latest videos, updates, and tips.
Subscribe to our ▶️ YouTube channel 🔴 for the latest videos, updates, and tips.
A function is a relation in which there is a unique output for each input. This means that each value of the independent variable (the domain) must correspond to one, and only one, value of the dependent variable (the range).
Functions can be represented graphically, numerically, or algebraically.
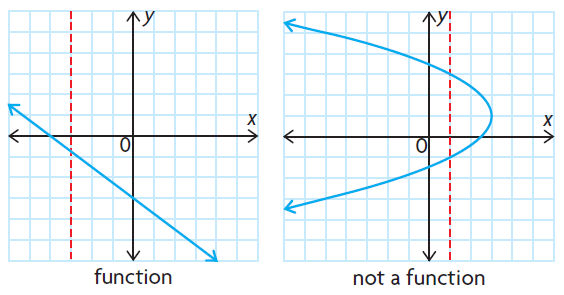
How to check the above relation is a function from the graph ?
- If the vertical line is intersecting the graph maximum at one point, then it is function.
- If the vertical line is intersecting the graph more than one points, then it is not a function.
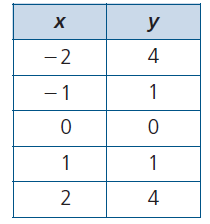
How to check the above relation is a function given numerically ?
Set of ordered pairs :
(1, 3) (3, 5) (-2, 9) (5, 11)
 |
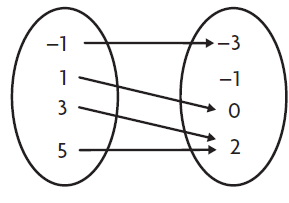 |
By observing the ordered pairs, table and arrow diagram, every input is having outputs. No input is having two different outputs. Then these are functions.
How to check the above relation is a function given algebraically ?
y = 2x - 5
- When x = -2, y = -9
- When x = 0, y = -5
- When x = 3, y = 1
So, each different values of x results different values of y. Then it is function
x2 + y2 = 9
When x = 0, y2 = 9
y = √9
y = ±3
The input 0 is having two different outputs, then it is not a function.
State the domain and range of each relation. Then determine whether the relation is a function, and justify your answer.
Problem 1 :
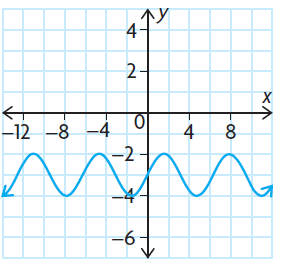
Solution :
The vertical line will intersect the graph maximum at one point. Then it is function.
- Domain is all real values, x ∈ R
- Range is -2 ≤ y ≤ -4
Problem 2 :
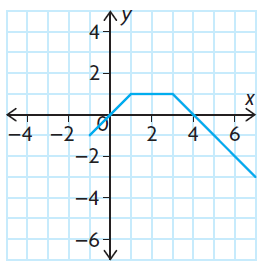
Solution :
It passes the vertical line test, then it is a function.
- Domain is -1 ≤ x ≤ 7
- Range is -3 ≤ y ≤ 1
Problem 3 :
{(1, 4) (1, 9) (2, 7) (3, -5) (4, 11)
Solution :
This is not afunction because 1 is sent to more than one element in the range.
- Domain = {1, 2, 3, 4}
- Range = {-5, 4, 9, 7, 11}
Problem 4 :
y = 3x - 5
Solution :
Every values of x will produce some values of y, then it is a function.
Domain is all real values, x ∈ R
Range is all real values, y ∈ R
Problem 5 :
y = 3x - 5
Solution :
Every values of x will produce some values of y, then it is a function.
Domain is all real values, x ∈ R
Range is all real values, y ∈ R
Problem 6 :
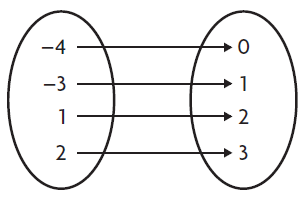
Solution :
Each input produces different output. Then it is function.
- Domain = {-4, -3, 1, 2}
- Range = {0, 1, 2, 3}
Problem 7 :
y = -5x2
Solution :
Domain is all real numbers,
- when x = -1, then y = -5(-1)2 ==> -5
- when x = 1, then y = -5(1)2 ==> -5
- when x = 0, then y = -5(0)2 ==> 0
This is a function because every element in the domain produces exactly one element in the range.
- Domain is all real numbers, x ∈ R
- Range is negative values including 0, then y ≤ 0
Problem 8 :
The following table gives Tina’s height above the ground while riding a Ferris wheel, in relation to the time she was riding it.

a) Draw a graph of the relation, using time as the independent variable and height as the dependent variable.
b) What is the domain?
c) What is the range?
d) Is this relation a function? Justify your answer.
e) Another student sketched a graph, but used height as the independent variable. What does this graph look like?
f) Is the relation in part e) a function? Justify your answer.
Solution :
a)
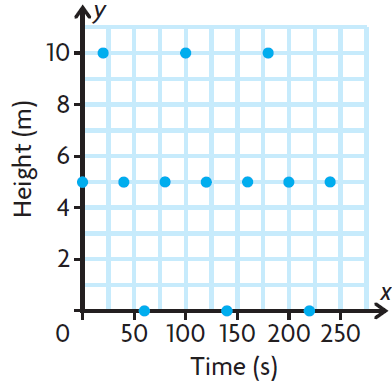
b) Domain = {0, 20, 40, 60, 80, 100, 120, 140, 160, 180, 200, 220, 240}
c) Range = {0, 5, 10}
d) It passes the vertical line test, then it is a function.
e) The points will be (5, 0) (10, 20) (5, 40) (0, 60) (5, 80) (10, 100),........ etc
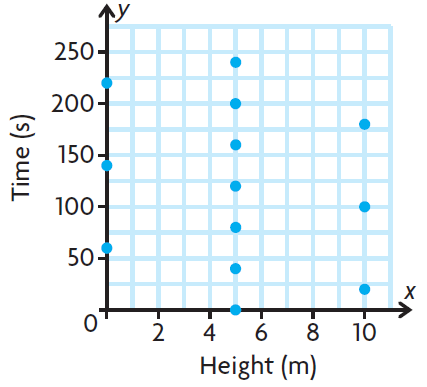
f) Since 5 is associated with 0 and 40. It is not a function.
Problem 9 :
Explain why a relation that fails the vertical line test is not a function.
Answer :
A relation that fails the vertical line test is not a function because a function must assign exactly one output (y-value) for each input (x-value). If a vertical line intersects the graph at more than one point, it means there is at least one x-value that corresponds to multiple y-values, violating the definition of a function.
Problem 9 :
A cell phone company charges a monthly fee of $30, plus $0.02 per minute of call time.
a) Write the monthly cost function, C(t) where t is the amount of time in minutes of call time during a month.
b) Find the domain and range of C.
Answer :
Monthly fee = $30
Let t be the amount of time in minutes during the month.
Cost per minute = $0.02
a) Monthly cost C(t) = 30 + 0.02 t
b) Domain is 0 ≤ x ≤ ∞
Range y ≥ 30
Recent Articles
-
Finding Range of Values Inequality Problems
May 21, 24 08:51 PM
Finding Range of Values Inequality Problems -
Solving Two Step Inequality Word Problems
May 21, 24 08:51 AM
Solving Two Step Inequality Word Problems -
Exponential Function Context and Data Modeling
May 20, 24 10:45 PM
Exponential Function Context and Data Modeling