EVALUATE THE GIVEN FROM VENN DIAGRAM OF TWO SETS
Subscribe to our ▶️ YouTube channel 🔴 for the latest videos, updates, and tips.
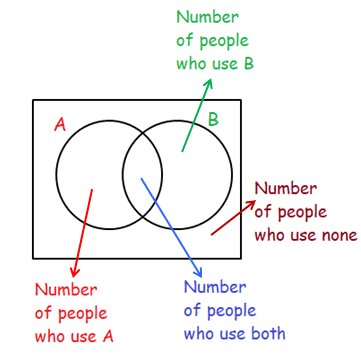
In math, Venn diagram is a method used to show the relationship between two quantities.
Each quantity will be represented in one separate circles.
Problem 1 :
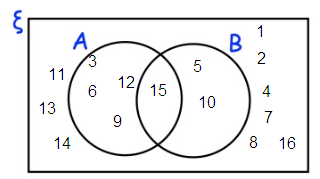
ξ = {1, 2, 3, 4, 5, 6, 7, 8, 9, 10, 11, 12, 13, 14, 15, 16}
A = multiples of 3
B = multiples of 5
a) Complete the Venn diagram
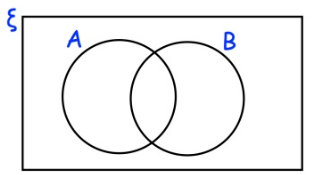
One of the numbers is selected at random.
b) Write down P(A ∩ B)
Solution :
a)
b)
A ∩ B = {15}
So, P(A ∩ B) =1/16
Problem 2 :
Here is a Venn diagram
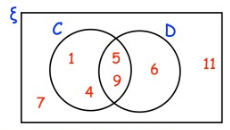
Write down the numbers that are in set
(a) D (b) C U D (c) C'
Solution :
By observing the diagram.
(a) D = {5, 6, 9}
(b) C U D = {1, 4, 5, 6, 9}
(c) C = {6, 7, 11}
Problem 3 :
At a wedding, the guests may have ice cream or custard with their dessert. The Venn diagram shows information about the choices the guests made.
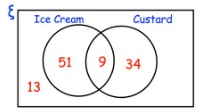
(a) How many guests had custard ?
(b) How many guests had ice cream and custard ?
(c) How many guests went to the wedding ?
Solution :
By observing the diagram.
(a)
Number of guests had custard = 9 + 34
= 43
Hence, 43 guests had custard.
(b) 9 guests had ice cream and custard.
(c)
Number of guests went to wedding
= 9 + 34 + 51 + 13
= 107
So, 8 guests went to the wedding.
Problem 4 :
Here is a Venn diagram.
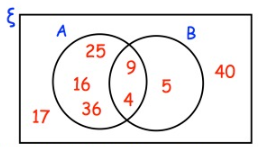
Write down the numbers that are in set
(a) A ∩ B
(b) A U B
(c) A'
One of the numbers in the diagram is chosen at random.
(d) Find the probability that the number is in set B'.
Solution :
(a) The variables in the common region of A and B are known as elements of A ∩ B.
A ∩ B = {4, 9}
(b) The variables inside the circles A and B are known as elements of the set A U B.
A U B = {4, 5, 9, 16, 25, 36}
(c)
A' = {5, 17, 40}
(d) The number is in set B' is not in B.
So, B' = 5
Total number = 8
To find probability :
= 5/8
Problem 5 :
Here is a Venn diagram.
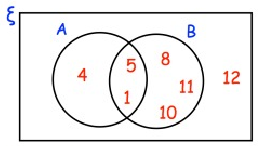
A number is chosen at random.
(a) Write down P(A ∩ B')
(b) Write down P(A' U B')
(c) Write down P(B/A)
Solution :
By observing the diagram.
(a) To find P(A ∩ B') :
A = {1, 4, 5}
B' = {4, 12}
A ∩ B' = 4
P(A ∩ B') = 1/7
(b) To find P(A' U B') :
A' = {8, 10, 11, 12}
B' = {4, 12}
A' U B' = {4, 8, 10, 11, 12}
P(A' U B') = {5/7}
(c) To find P(B/A) :
P(B/A) = P(A ∩ B)/P(A)
A ∩ B = {1, 5}
P(A ∩ B) = 2/7
P(A) = 3/7
P(B/A) = 2/7/3/7
= 2/7 × 7/3
P(B/A) = 2/3
Problem 6 :
The Venn diagram shows information about the cars in a car park.
ξ = 150 cars in the car park
R = red cars
J = cars manufactured in Japan
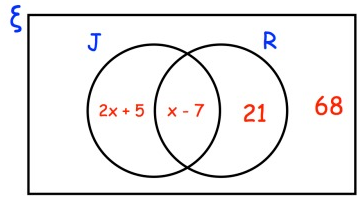
A car is chosen at random.
Work out the probability that it is red.
Solution :
150 cars in the car park.
2x + 5 + x - 7 + 21 + 68 = 150
3x + 87 = 150
3x = 63
x = 63/3
x = 21
x = 21 substitute the equation x - 7.
= 21 - 7
= 14
21 + 14 = 35
To find the probability :
= 35/150
= 7/30
Problem 7 :
The Venn diagram shows information about the pets owned by 40 students
ξ = 40 students
C = students who own a cat
D = students who own a dog
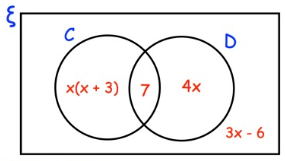
A student is chosen at random.
They own a cat.
Work out the probability that they own a dog.
Solution :
x(x + 3) + 7 + 4x + 3x - 6 = 40
x2 + 3x + 7 + 4x + 3x - 6 = 40
x2 + 10x + 1 = 40
x2 + 10x + 1 - 40 = 0
x2 + 10x - 39 = 0
x2 + 13x - 3x - 39 = 0
x(x + 13) - 3(x + 13) = 0
(x - 3) (x + 13) = 0
x - 3 = 0 and x + 13 = 0
x = 3 and x = -13
= x(x + 3) + 7
= 3(3 + 3) + 7
= 18 + 7
= 25
They own a cat is 25.
The probability that they own a dog is 7/25.
Subscribe to our ▶️ YouTube channel 🔴 for the latest videos, updates, and tips.
Recent Articles
-
Finding Range of Values Inequality Problems
May 21, 24 08:51 PM
Finding Range of Values Inequality Problems -
Solving Two Step Inequality Word Problems
May 21, 24 08:51 AM
Solving Two Step Inequality Word Problems -
Exponential Function Context and Data Modeling
May 20, 24 10:45 PM
Exponential Function Context and Data Modeling