DRAW BOX AND WHISKER PLOT FROM THE GIVEN INFORMATION
Subscribe to our ▶️ YouTube channel 🔴 for the latest videos, updates, and tips.
To draw the box and whisker plot, we have to follow the instruction given below.
Step 1 :
Arrange the data from least to greatest
Step 2 :
Calculate the median(Q2) which divides the data into two equal parts.
Step 3 :
- Calculate the lower quartile (Q1) by finding the median of lower half.
- Calculate the upper quartile (Q3) by finding the median of upper half.
Step 4 :
- Starting from the least value draw the tail and at least value start drawing box.
Subscribe to our ▶️ YouTube channel 🔴 for the latest videos, updates, and tips.
Draw a box plot for each of the following.
Problem 1:
Solution :
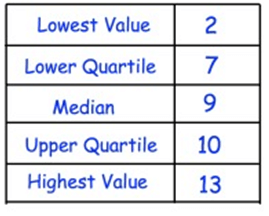
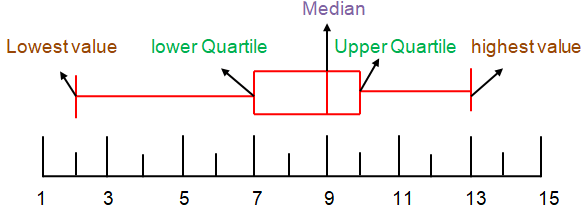
Least value = 2
Lower Quartile (Q1) = 7
Median (Q2) = 9
Upper Quartile (Q3) = 10
Highest value = 13
Problem 2 :
Solution :
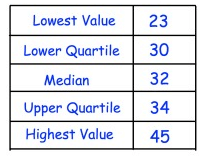
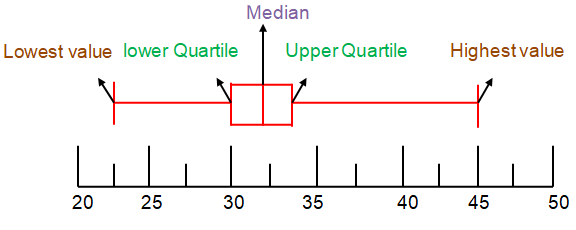
Least value = 23
Lower Quartile (Q1) = 30
Median (Q2) = 32
Upper Quartile (Q3) = 34
Highest value = 45
Problem 3 :
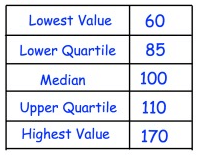
Solution :
Least value = 60
Lower Quartile (Q1) = 81
Median (Q2) = 100
Upper Quartile (Q3) = 110
Highest value = 170
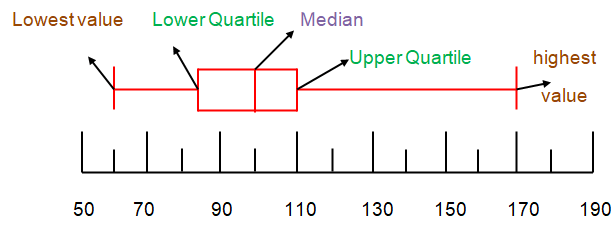
Draw a box plot for each of the following.
Problem 4 :
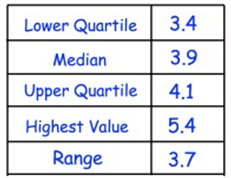
Solution :
Range = largest value - smallest value
3.7 = 5.4 - x
x = 1.7
Smallest value = 1.7
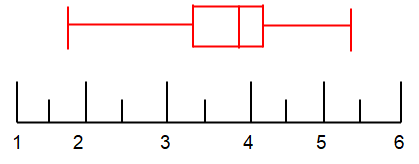
Problem 5 :
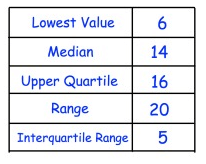
Solution :
Range = largest value - smallest value
20 = x - 6
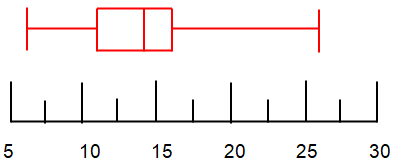
x = 26
Largest value = 26
Interquartile Range = Upper Quartile - Lower Quartile
5 = 16 - x
x = 11
Lower Quartile = 11
Problem 6 :
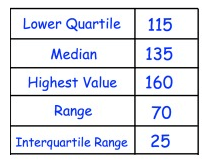
Solution :
Range = largest value - smallest value
70 = 160 - x
x = 90
Smallest value = 90
Interquartile Range = Upper Quartile - Lower Quartile
25 = x - 115
x = 140
Upper Quartile = 140

Recent Articles
-
Finding Range of Values Inequality Problems
May 21, 24 08:51 PM
Finding Range of Values Inequality Problems -
Solving Two Step Inequality Word Problems
May 21, 24 08:51 AM
Solving Two Step Inequality Word Problems -
Exponential Function Context and Data Modeling
May 20, 24 10:45 PM
Exponential Function Context and Data Modeling