DOT PLOTS AND DATA DISTRIBUTION
Subscribe to our ▶️ YouTube channel 🔴 for the latest videos, updates, and tips.
Use the data set at the right and the description below to complete Exercises.
Problem 1 :
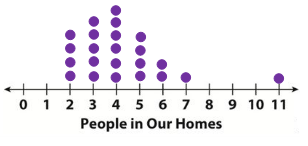
The class took a survey about how many people live in each students home. The results are shown at the bottom.

1. Make a dot plot of the data.

2. Find the mean, median, and range of the data.
mean: _____; median: _____; range: _____
3. Describe the spread, center, and shape of the distribution.
4. Which number is an outlier in the data set? Explain what effect the outlier has on the measures of center and spread.
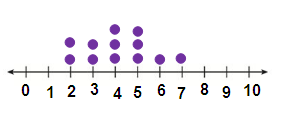
5. 12 students were surveyed to find how many people live in their homes.
2, 4, 5, 3, 7, 2, 5, 3, 4, 5, 6, 4
Use this data to make a box plot at the right.
Solution :
|
Number of people are living at home 2 3 4 5 6 7 11 |
Frequency 4 5 6 4 2 1 1 |

2)
Mean:
2, 2, 2, 2, 3, 3, 3, 3, 3, 4, 4, 4, 4, 4, 4, 5, 5, 5, 5, 6, 6, 7, 11
Mean = Sum of data / Total number of data
= 97/23
= 4.21
Median:
2, 2, 2, 2, 3, 3, 3, 3, 3, 4, 4, 4, 4, 4, 4, 5, 5, 5, 5, 6, 6, 7, 11
Median = 4
Range:
Range = maximum data - minimum data
= 11 - 2
= 9
3) Spread :
Maximum people's home there were 4 people living.
Center :
Center or median = 4.
Shape :
The data is skewed to the right.
4) Outlier is 11.
5)

Mean:
2, 2, 3, 3, 4, 4, 4, 5, 5, 5, 6, 7
Mean = sum of data / Total number of data
= 50/12
= 4.16
Median:
2, 2, 3, 3, 4, 4, 4, 5, 5, 5, 6, 7
Number of given data = 12
Median = (12/2)th value + [(12/2) + 1]th value
= (6th value + 7th value)/2
= (4 + 4)/2
= 4
Subscribe to our ▶️ YouTube channel 🔴 for the latest videos, updates, and tips.
Recent Articles
-
Finding Range of Values Inequality Problems
May 21, 24 08:51 PM
Finding Range of Values Inequality Problems -
Solving Two Step Inequality Word Problems
May 21, 24 08:51 AM
Solving Two Step Inequality Word Problems -
Exponential Function Context and Data Modeling
May 20, 24 10:45 PM
Exponential Function Context and Data Modeling