CLASSIFY THE SCATTER PLOTS AND TYPES OF CORRELATION
Subscribe to our ▶️ YouTube channel 🔴 for the latest videos, updates, and tips.
How to classify the scatter plots and types of correlation ?
Correlation is a relationship between two quantities or variable.
The relationship may be positive, negative sometimes there may not be any relationship between them. Then, we should say there is no correlation.
The 'line of best fit' is a line that goes roughly through the middle of all the scatter points on a graph.
The closer the points are to the line of best fit the stronger the correlation is.
If the slope of a regression line is positive, then the two variables have a positive correlation.
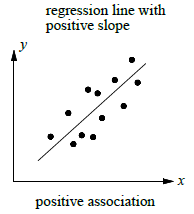
If the slope of regression line is negative , then the two variables have a negative correlation.
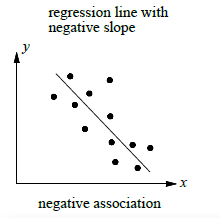
If the slope of regression line cannot be determined, then the two variables have no correlation.
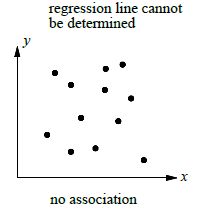
Classify the scatter plots has positive, negative or no correlation.
Problem 1 :
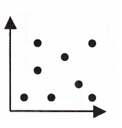
Solution :
The spread is every where. So, there is no correlation between the quantities.
Problem 2 :
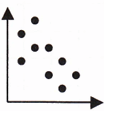
Solution :
The spread is like a falling line. Then there is a negative correlation.
Problem 3 :
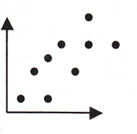
Solution :
The spread is like a raising line. Then there is a positive correlation.
Problem 4 :
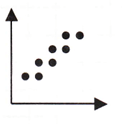
Solution :
The spread is like a raising line. So, there is positive correlation between the quantities.
Problem 5 :
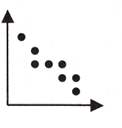
Solution :
The spread is like a falling. So, there is negative correlation between the quantities.
Problem 6 :
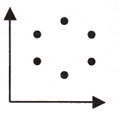
Solution :
The spread is everywhere. So, there is negative correlation between the quantities.
Determine whether a scatter plot of the data for the following might show a positive, negative, or no relationship.
Problem 7 :
a person’s jogging speed and time spent jogging
Solution :
A person is increasing his jogging speed, he may feel tired in short time. So, time spending for jogging may reduce. So, there is negative correlation between speed and time spent.
Problem 8 :
the size of a family and the weekly grocery bill
Solution :
Based on the size of the family, grocery bill will increase or decrease. So, there is positive correlation between size of the family and grocery bill.
Problem 9 :
the size of a car and the cost
Solution :
There is some standard sizes. So, based on size the cost will not differ. There is no relationship.
Problem 10 :
a person’s weight and percent body fat
Solution :
If weight increases then their fat will also increase. So, there is positive correlation.
Problem 11 :
time spent playing video games and time spent on outdoor activity
Solution :
Time spent on playing video games increases then time spent on outdoor activity will decrease. So, there is negative correlation.
Identify the data sets as having a positive, a negative or a no correlation.
Problem 12 :
The number of hours a person has driven and the number of miles driven
Solution :
Positive correlation.
Problem 13 :
The number of siblings a student has and the grade they have in math class.
Solution :
There is no relationship between number of siblings and the grade. So, there is no correlation.
Problem 14 :
The age of of a car and the value of car.
Solution :
If age of the car increases then depreciation will be there, So, negative correlation.
Problem 15 :
The number of weeks a CD has been out and the total sales.
Solution :
Positive correlation.
Problem 16 :
The number of years a person went to school and their income.
Solution :
If experience increases then their income will also increase. So, there is positive correlation.
Problem 17 :
The number of songs downloaded on your i-pod and the amount of memory available.
Solution :
If number of songs downloaded will affect the capacity of storage. So, there is negative correlation.
Problem 18 :
The amount spent on the computer instant messaging your friends and the number of computers in your house.
Solution :
There is no correlation.
Problem 19 :
The age of a house and the number of people living in the house.
Solution :
There is no relation or no correlation.
Subscribe to our ▶️ YouTube channel 🔴 for the latest videos, updates, and tips.
Recent Articles
-
Finding Range of Values Inequality Problems
May 21, 24 08:51 PM
Finding Range of Values Inequality Problems -
Solving Two Step Inequality Word Problems
May 21, 24 08:51 AM
Solving Two Step Inequality Word Problems -
Exponential Function Context and Data Modeling
May 20, 24 10:45 PM
Exponential Function Context and Data Modeling