SAT PRACTICE QUESTIONS ON COMPOSITION OF FUNCTION
Subscribe to our ▶️ YouTube channel 🔴 for the latest videos, updates, and tips.
Problem 1 :
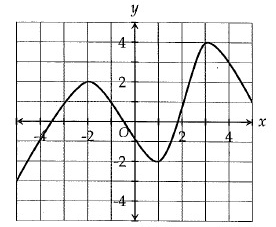
What is the difference between the minimum and maximum values of the function graphed in the xy-plane above, for -5 ≤ x ≤ 5?
Solution:
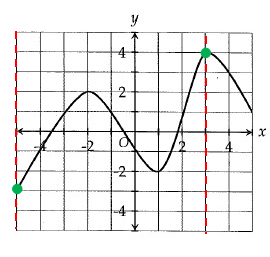
When x = -5, y is the minimum = -3
When x = 3, y is the minimum = 4
So, the difference is |-3 - 4| = 7
Problem 2 :
In the xy-plane, the points (a, 7) and (b, 12) lie on the graph of y = x2 + 3. What is the minimum possible value of a + b?
A) -5 B) -1 C) 1 D) 5
Solution:
Given, y = x2 + 3
7 = a2 + 3
a2 = 7 - 3
a2 = 4
a = 2 or a = -2
12 = b2 + 3
b2 = 9
b = 3 or b = -3
Minimum value, a = -2 and b = -3
a + b = -2 - 3
a + b = -5
So, option (A) is correct.
Problem 3 :
The functions f and g are defined by f(x) = x2 + 2 and g(x) = 4x - 3. If a > 0, for what value of a does g(f(a)) = 41?
Solution:
Given, f(x) = x2 + 2
f(a) = a2 + 2
g(f(a)) = 4(a2 + 2) - 3
4a2 + 8 - 3 = 41
4a2 + 5 - 41 = 0
4a2 - 36 = 0
4a2 = 36
a2 = 36/4
a2 = 9
a = ±3
Problem 4 :
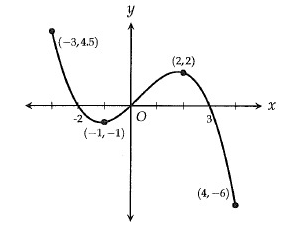
The function y = f(x), defined for -3 ≤ x ≤ 4, is graphed in the xy-plane above. Which of the following gives all values of x for which f(x) is negative.
A) -3 ≤ x ≤ 4 B) -2 < x ≤ 4 C) -2 < x < 0 and 3 < x ≤ 4
D) -3 ≤ x < -2 and 0 < x < 3
Solution :
By observing the figure,
- in between -2 and 0, the curve is below the x-axis.
- In between 3 to 4, the curve is below the x-axis.
From this, the output is negative.
So, the answer is -2 < x < 0 and 3 < x ≤ 4
Problem 5 :
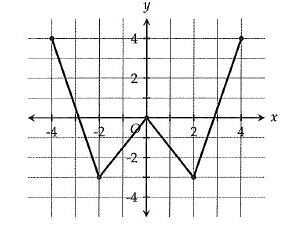
The complete function f is shown in the xy-plane above. If f(x) = k has two solutions, which of the following could be the value of k?
I. -3 II. 0 III. 2.5
A) I and II only B) III only C) I and III only
D) I, II and III
Solution:
f(x) = k
Drawing the horizontal lines at -3, 0 and 2.5, the horizontal lines intersecting the curve at two different values.
I, II, III, option D is correct.
Problem 6 :
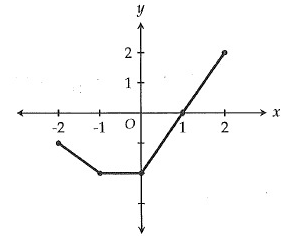
The graph of f(x) is shown in the xy-plane above. If f(a) = -2, which of the following is a possible value of a?
A) -1.5 B) -0.5 C) 1 D) 2
Solution:
According to the graph,
f(x) = -2
y = -2
Drawing the horizontal line through y = -2
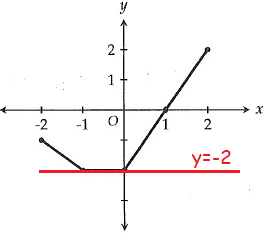
-1 ≤ x ≤ 0
f(-0.5) = -2
So, option (B) is correct.
Problem 7 :
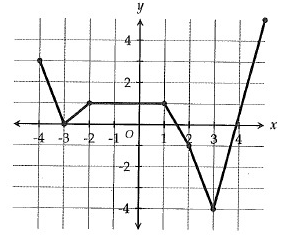
The graph above shows the function g. What is the value of g(3) ?
A) -4 B) 0 C) 3 D) 4
Solution:
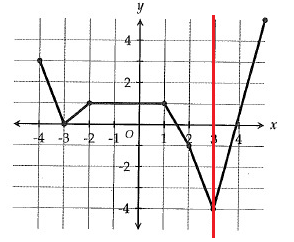
The value of g(3) = -4
So, option (A) is correct.
Subscribe to our ▶️ YouTube channel 🔴 for the latest videos, updates, and tips.
Recent Articles
-
Finding Range of Values Inequality Problems
May 21, 24 08:51 PM
Finding Range of Values Inequality Problems -
Solving Two Step Inequality Word Problems
May 21, 24 08:51 AM
Solving Two Step Inequality Word Problems -
Exponential Function Context and Data Modeling
May 20, 24 10:45 PM
Exponential Function Context and Data Modeling